

Relative house price behaviour between different parts of the market, like Auckland and Christchurch, is in general driven by variations in demand and supply—a fundamental principle of economics.
Auckland currently has one of the weakest demand-supply equations of any major centre in New Zealand (second only to Wellington) while Christchurch has one of the strongest.
This can be seen by comparing REINZ dwelling sales with median days to sell—Auckland in the first chart below, Christchurch in the second—and by taking into account the relative number of properties listed for sale (third chart, data from www.realestate.co.nz).
Sales are largely driven by demand, although at times supply can have some impact; days to sell are driven by the interaction between demand and supply; meanwhile, for sale listings are a measure of supply but are also impacted by demand/sales.
The first two charts are calibrated in such a way that if sales numbers are sitting above days to sell it suggests the demand-supply balance supports rising prices; while prices can be expected to fall if sales numbers are below days to sell.
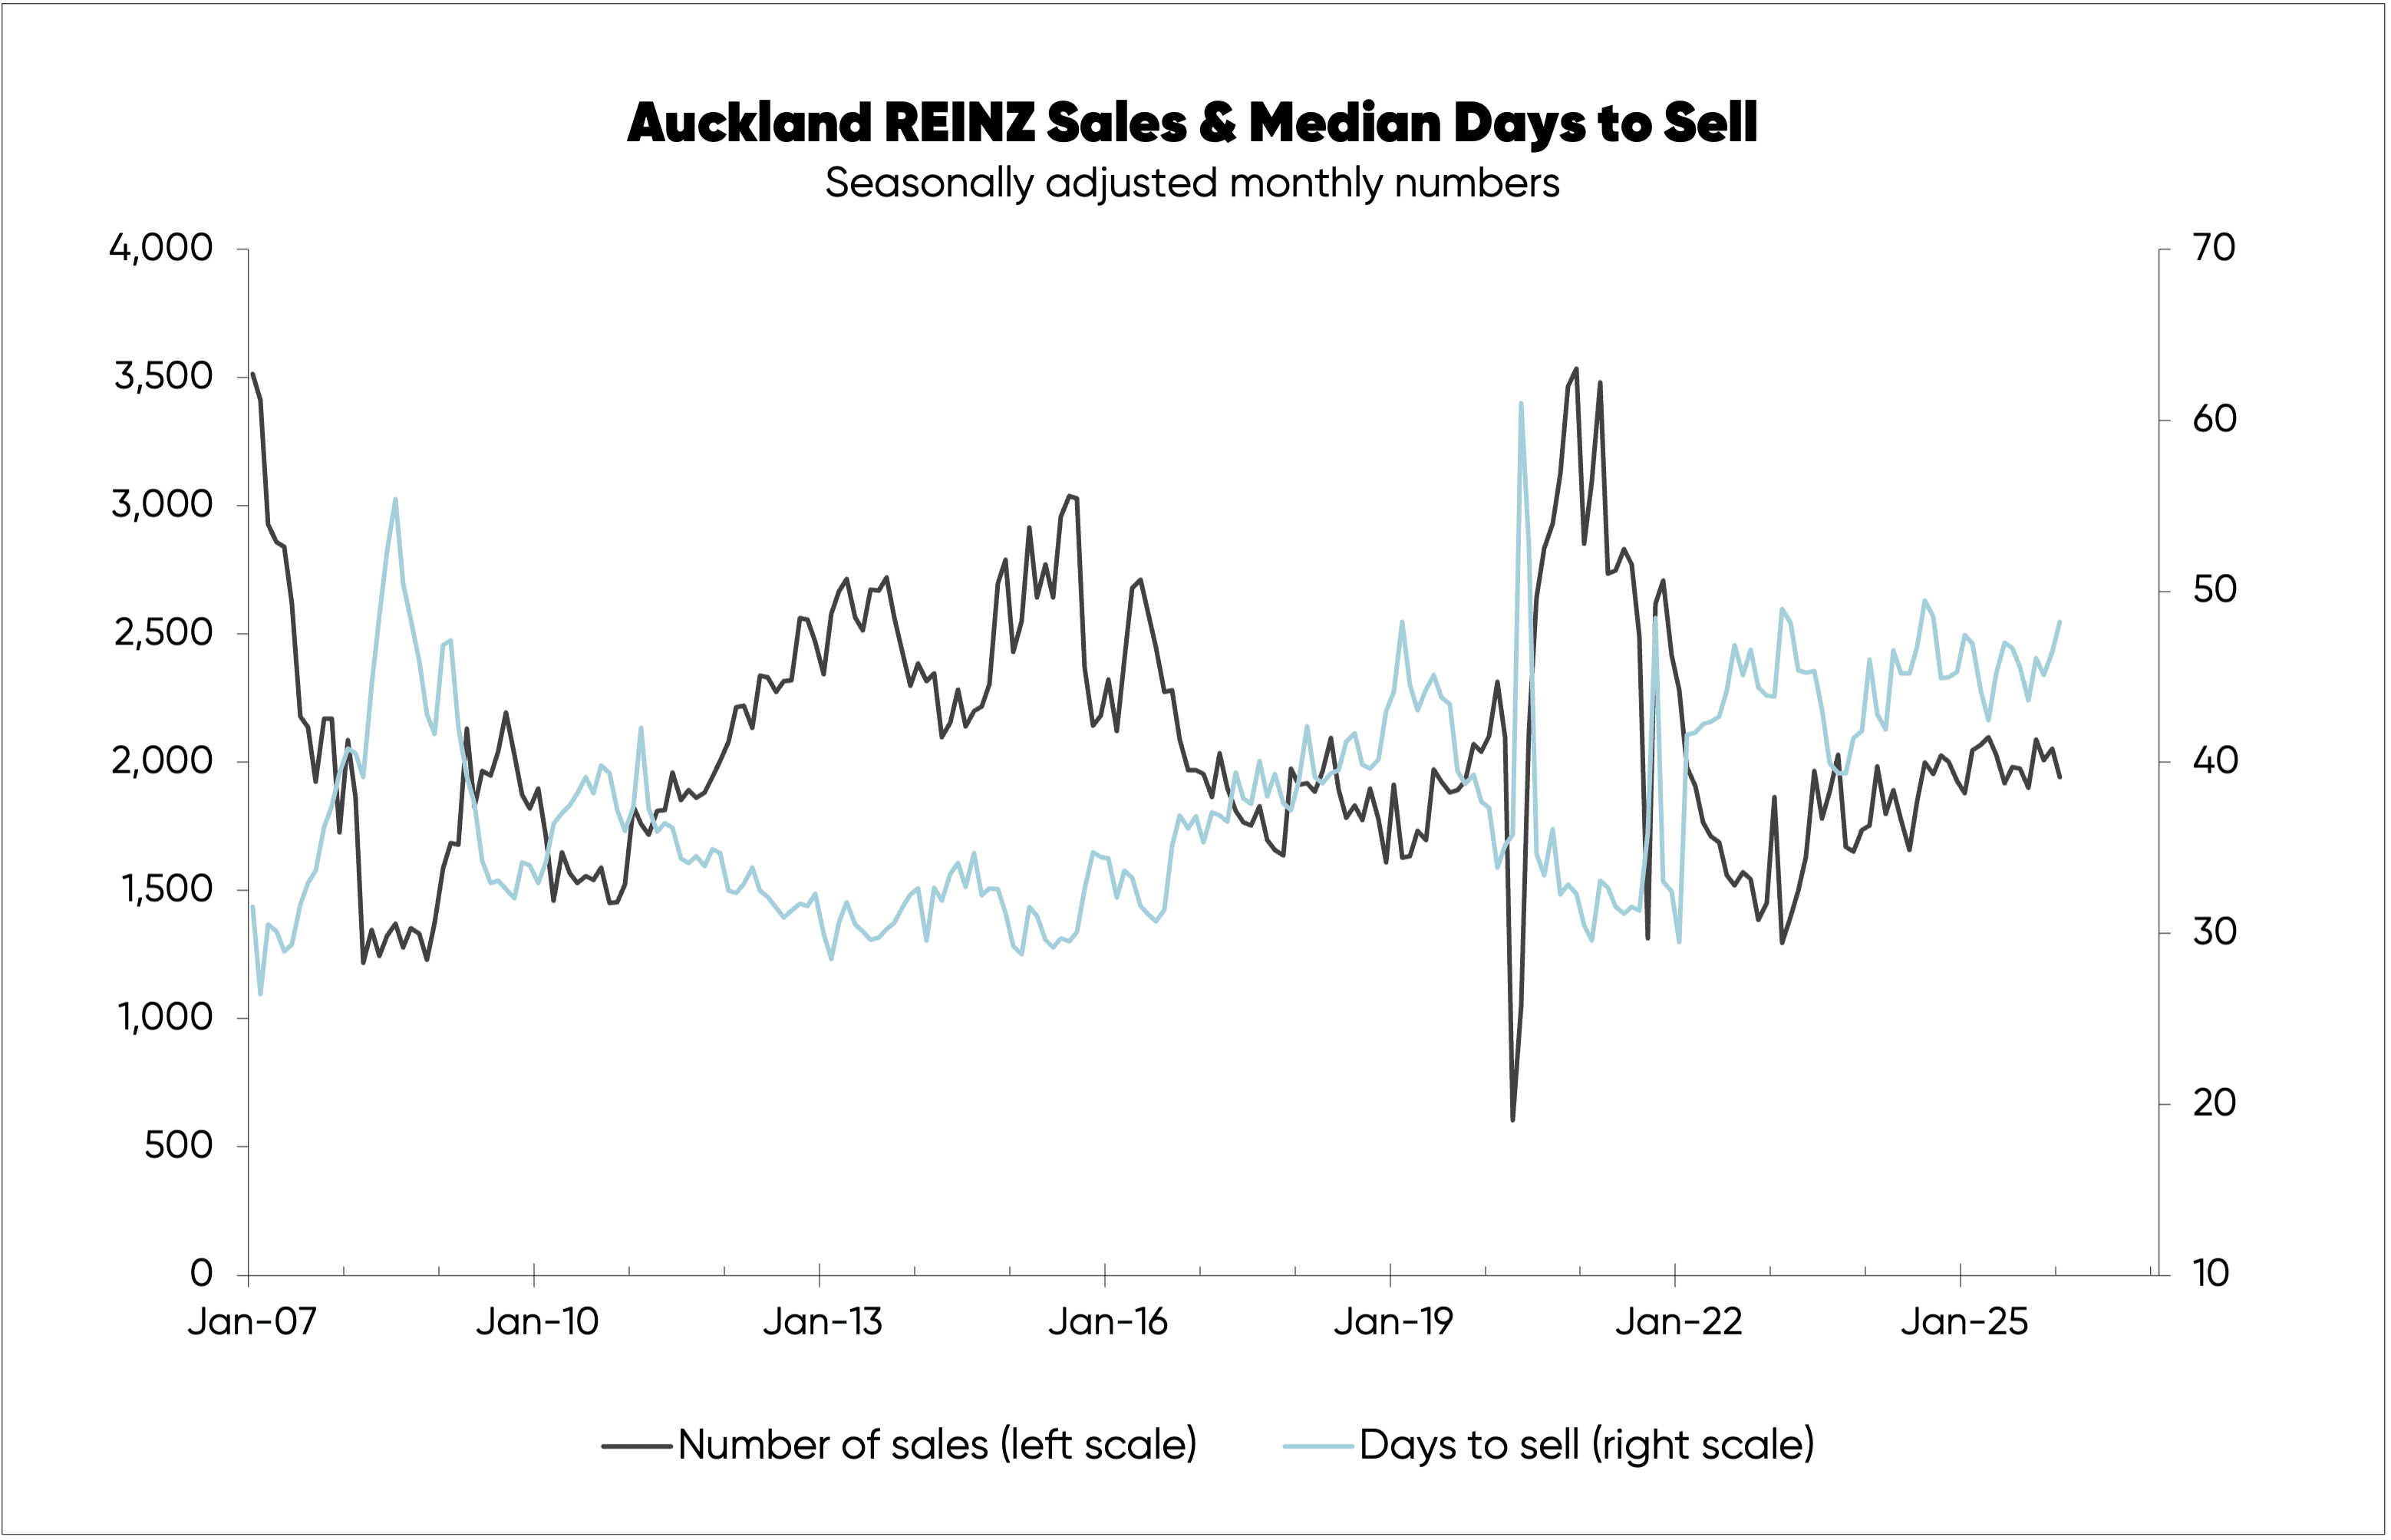
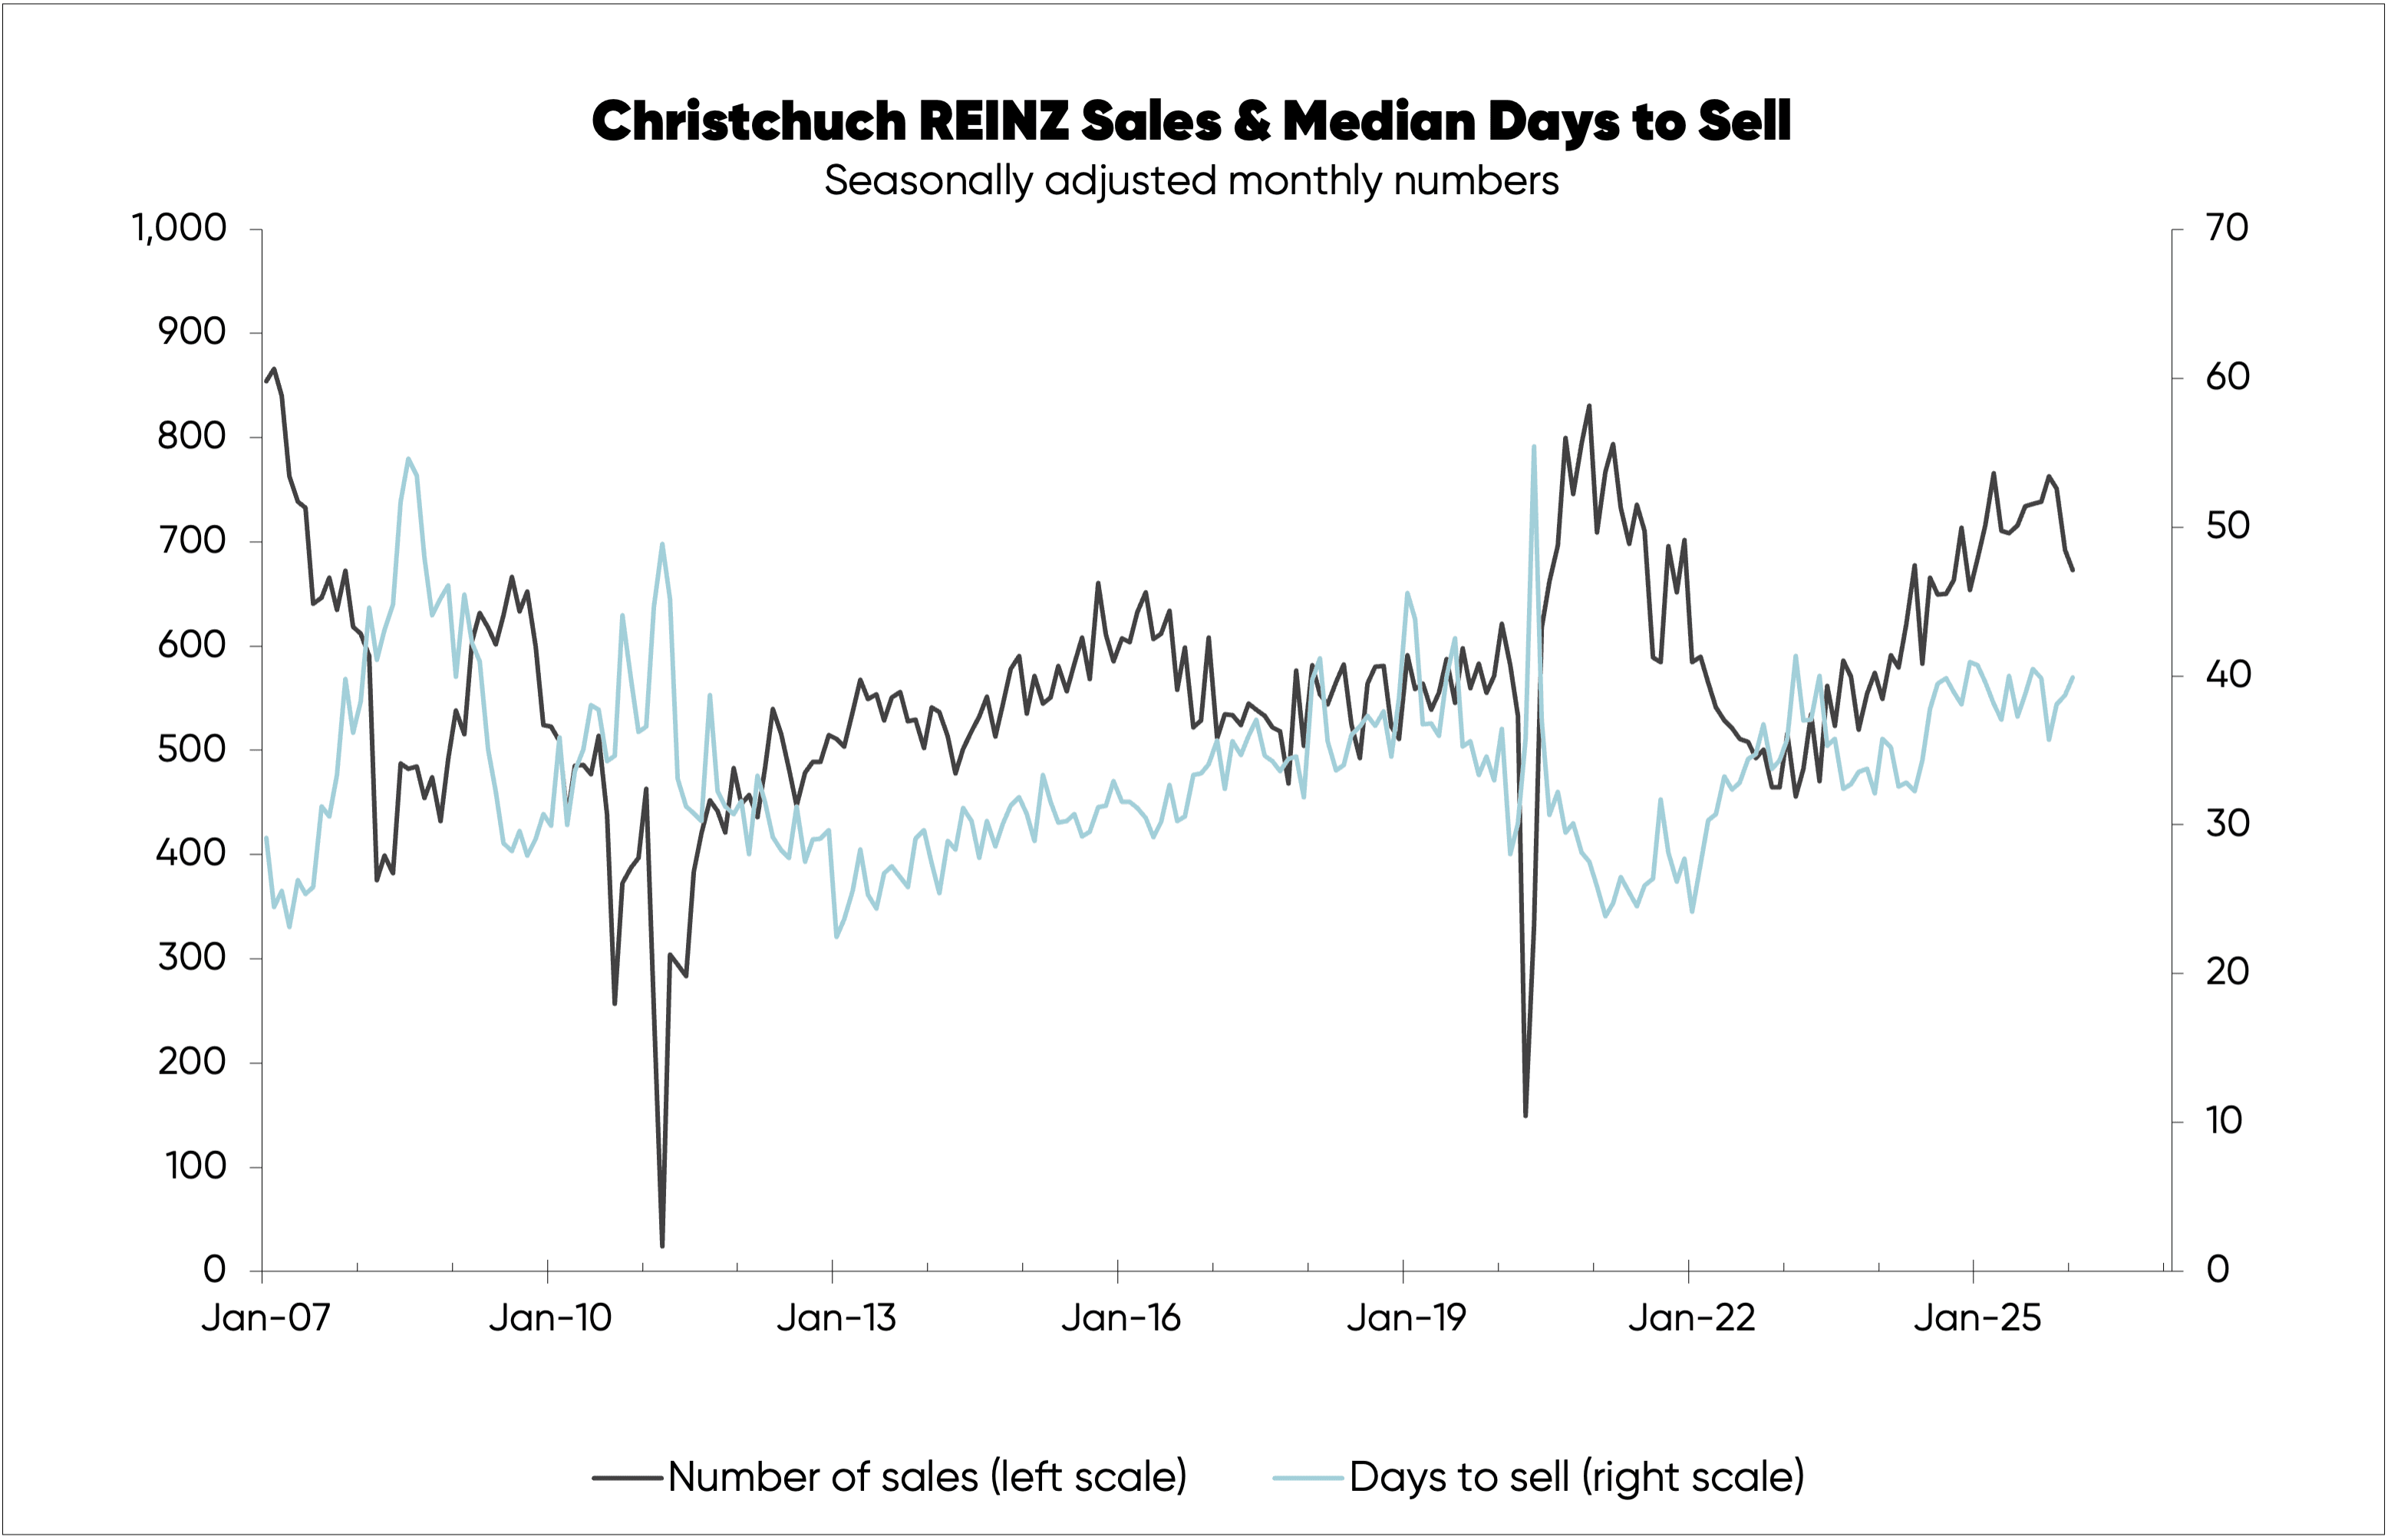
These charts clearly show a much stronger demand-supply balance in Christchurch, and a downside risk to prices in Auckland, where sales are above days to sell.
Sales and days to sell have been adjusted to remove regular seasonal behaviour—such as typically lower sales over the holiday period from December through January—to better show the underlying demand-supply balances.
The third chart shows for sale listings across the two regions for the various categories of dwellings on www.realestate.co.nz. Listings are also seasonally adjusted to better show the underlying picture.

Compared to the historical level, Auckland has a relatively high number of listings compared to Christchurch.
Considering the current and recent demand-supply balances for the two areas, it should be no surprise that Christchurch house prices are outperforming those in Auckland.
This is demonstrated in the fourth chart, which uses REINZ House Price Indices data, a more reliable measure of underlying price behaviour than median prices.
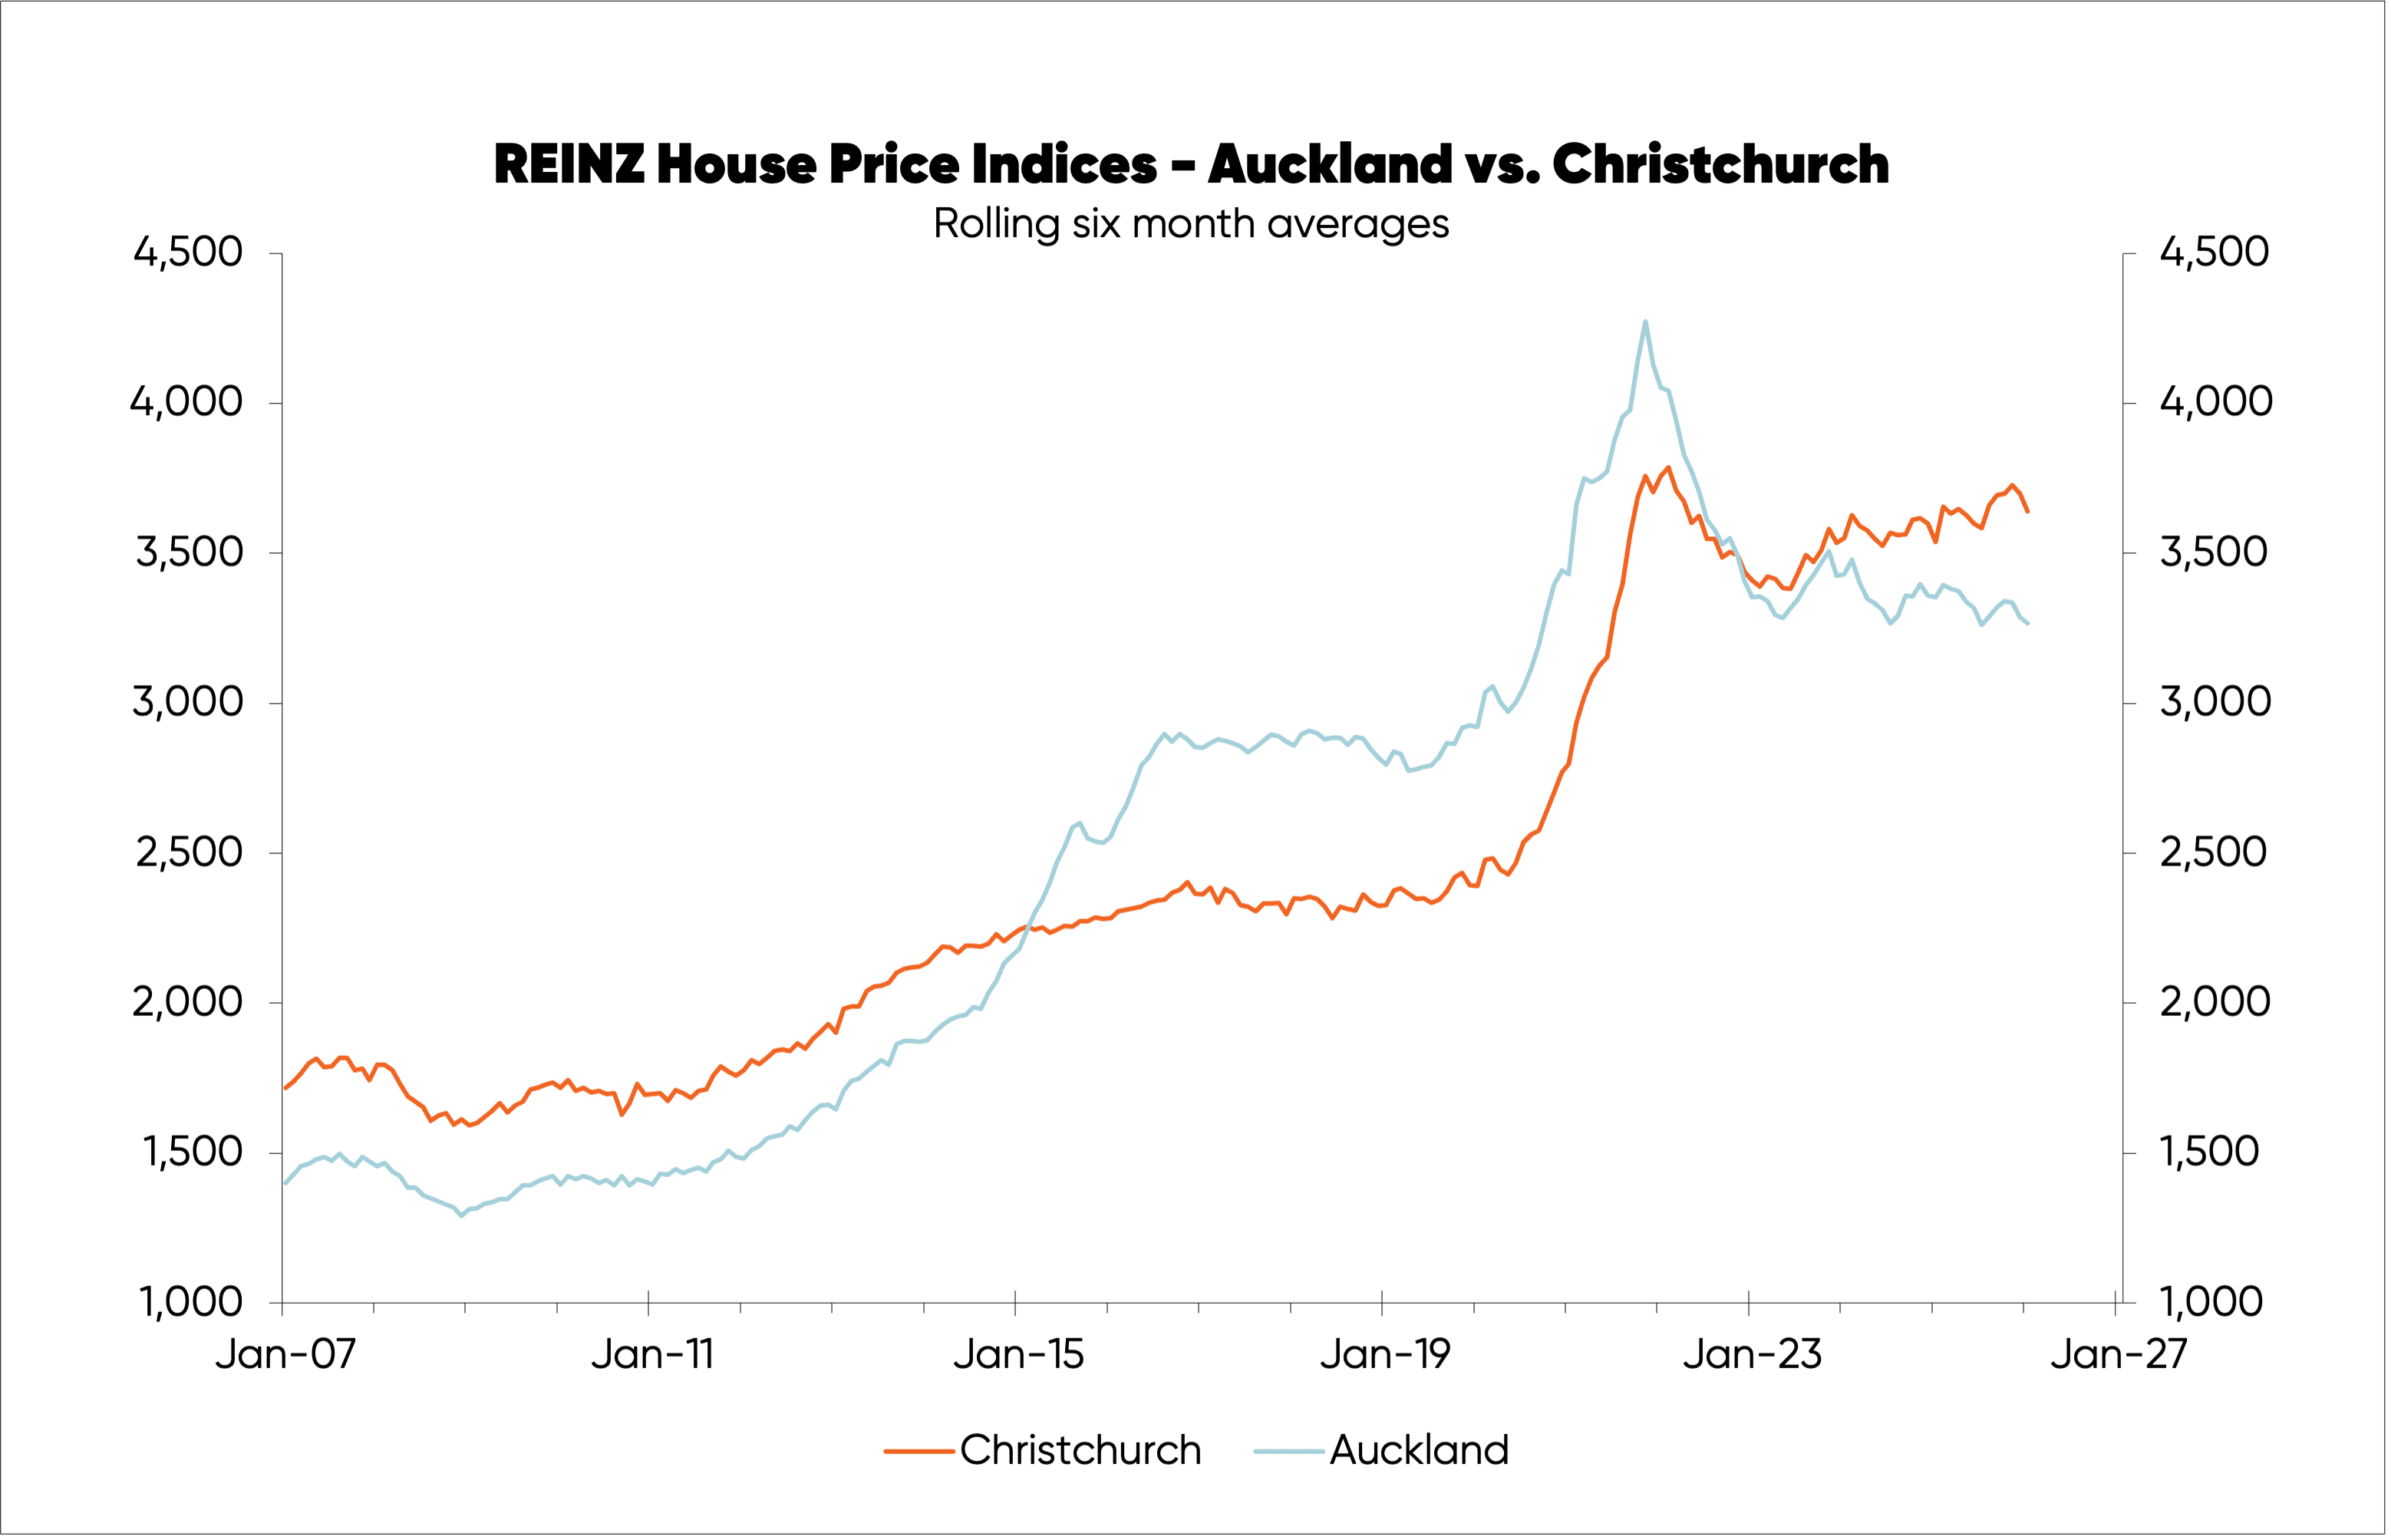
But the outperformance of Christchurch prices isn’t as much as seems justified by the first three charts. This may be because there is some NZ-wide link in house price behaviour.
Interest rates are the primary driver of the national housing cycle. But variations across different regions are impacted by relative economic and employment conditions in those areas, as well as levels of construction.
Christchurch currently has a stronger labour market based on job ads (chart not shown), while there have been townhouse building booms in both areas that delivered cheaper new housing (with townhouses much smaller than houses) which will have undermined upside in house prices.

About the author: Rodney Dickens, Strategic Risk Analysis - Managing Director
As far as economists are concerned, Rodney’s about as seasoned as they come. Having started out his career at the RBNZ—including a stint on its Monetary Policy Committee—he’s held roles as Head of Research and Chief Economist inside several of New Zealand's big banks and leading financial institutions, and worked for the Bank of England. He launched Strategic Risk Analysis in 2006, regularly reporting on the state of the economy, housing market and interest rates.