

Before policies like the Auckland Unitary Plan came into effect—intended to promote higher housing density in the main urban centres—it was generally the case that where existing housing prices went, residential construction costs usually followed.
Now the relationship may be the other way around.
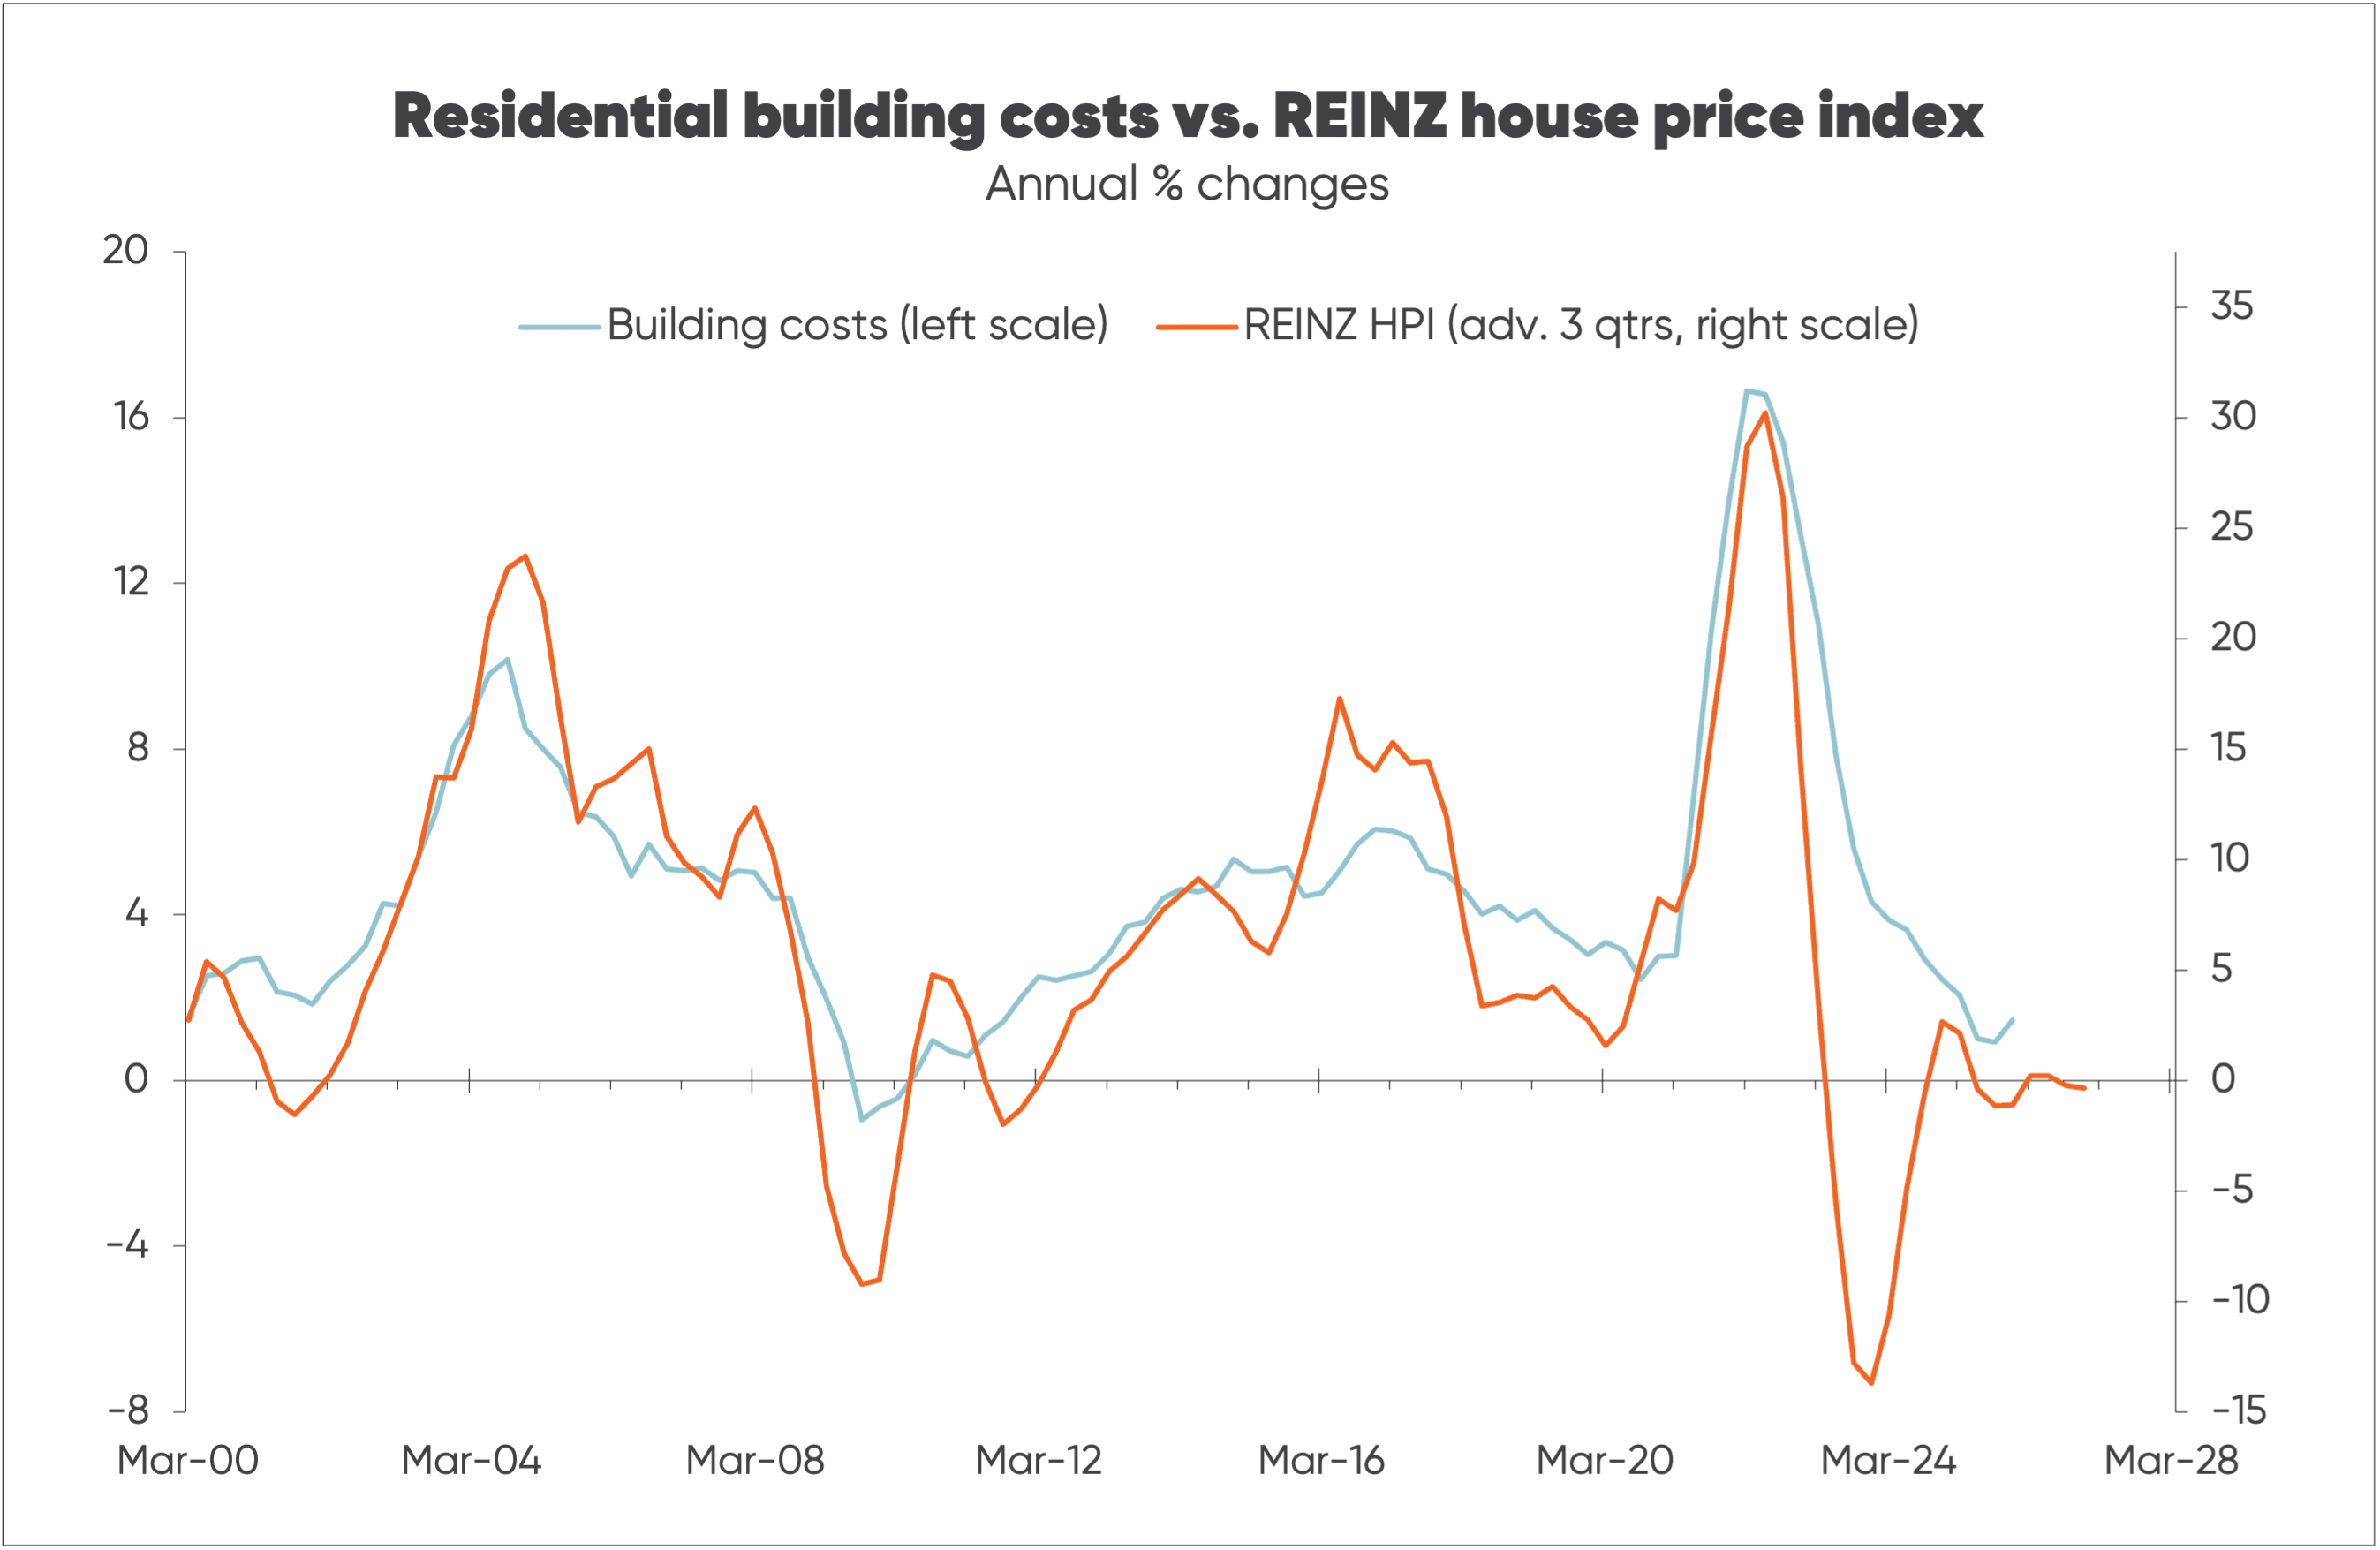
There’s an argument to suggest that rising construction costs (as a result of spiking oil prices) may eventually provide some upside for existing house prices.
Historically, there’s been a bit of a lag before house price changes have been reflected in build costs.
The best fit is shown in the chart below—using Stats NZ’s building cost measure and the REINZ House Price Index (HPI)—with build cost inflation advanced by three quarters, or nine months.
Why has the existing housing market traditionally led price changes?
Put simply, because the existing housing market has generally been faster to respond to interest rates than the new-build market. Migration was also an important driver, but interest rates dominated.
Government and council policies aimed at boosting housing intensification have changed the link between the existing and new housing markets.
Starting from 2018, these policies have contributed to a mega-boom in townhouse construction (including terraced housing) particularly in Auckland—which has seen consents for new townhouses rise dramatically relative to consents for standalone houses, as shown in the second chart below.
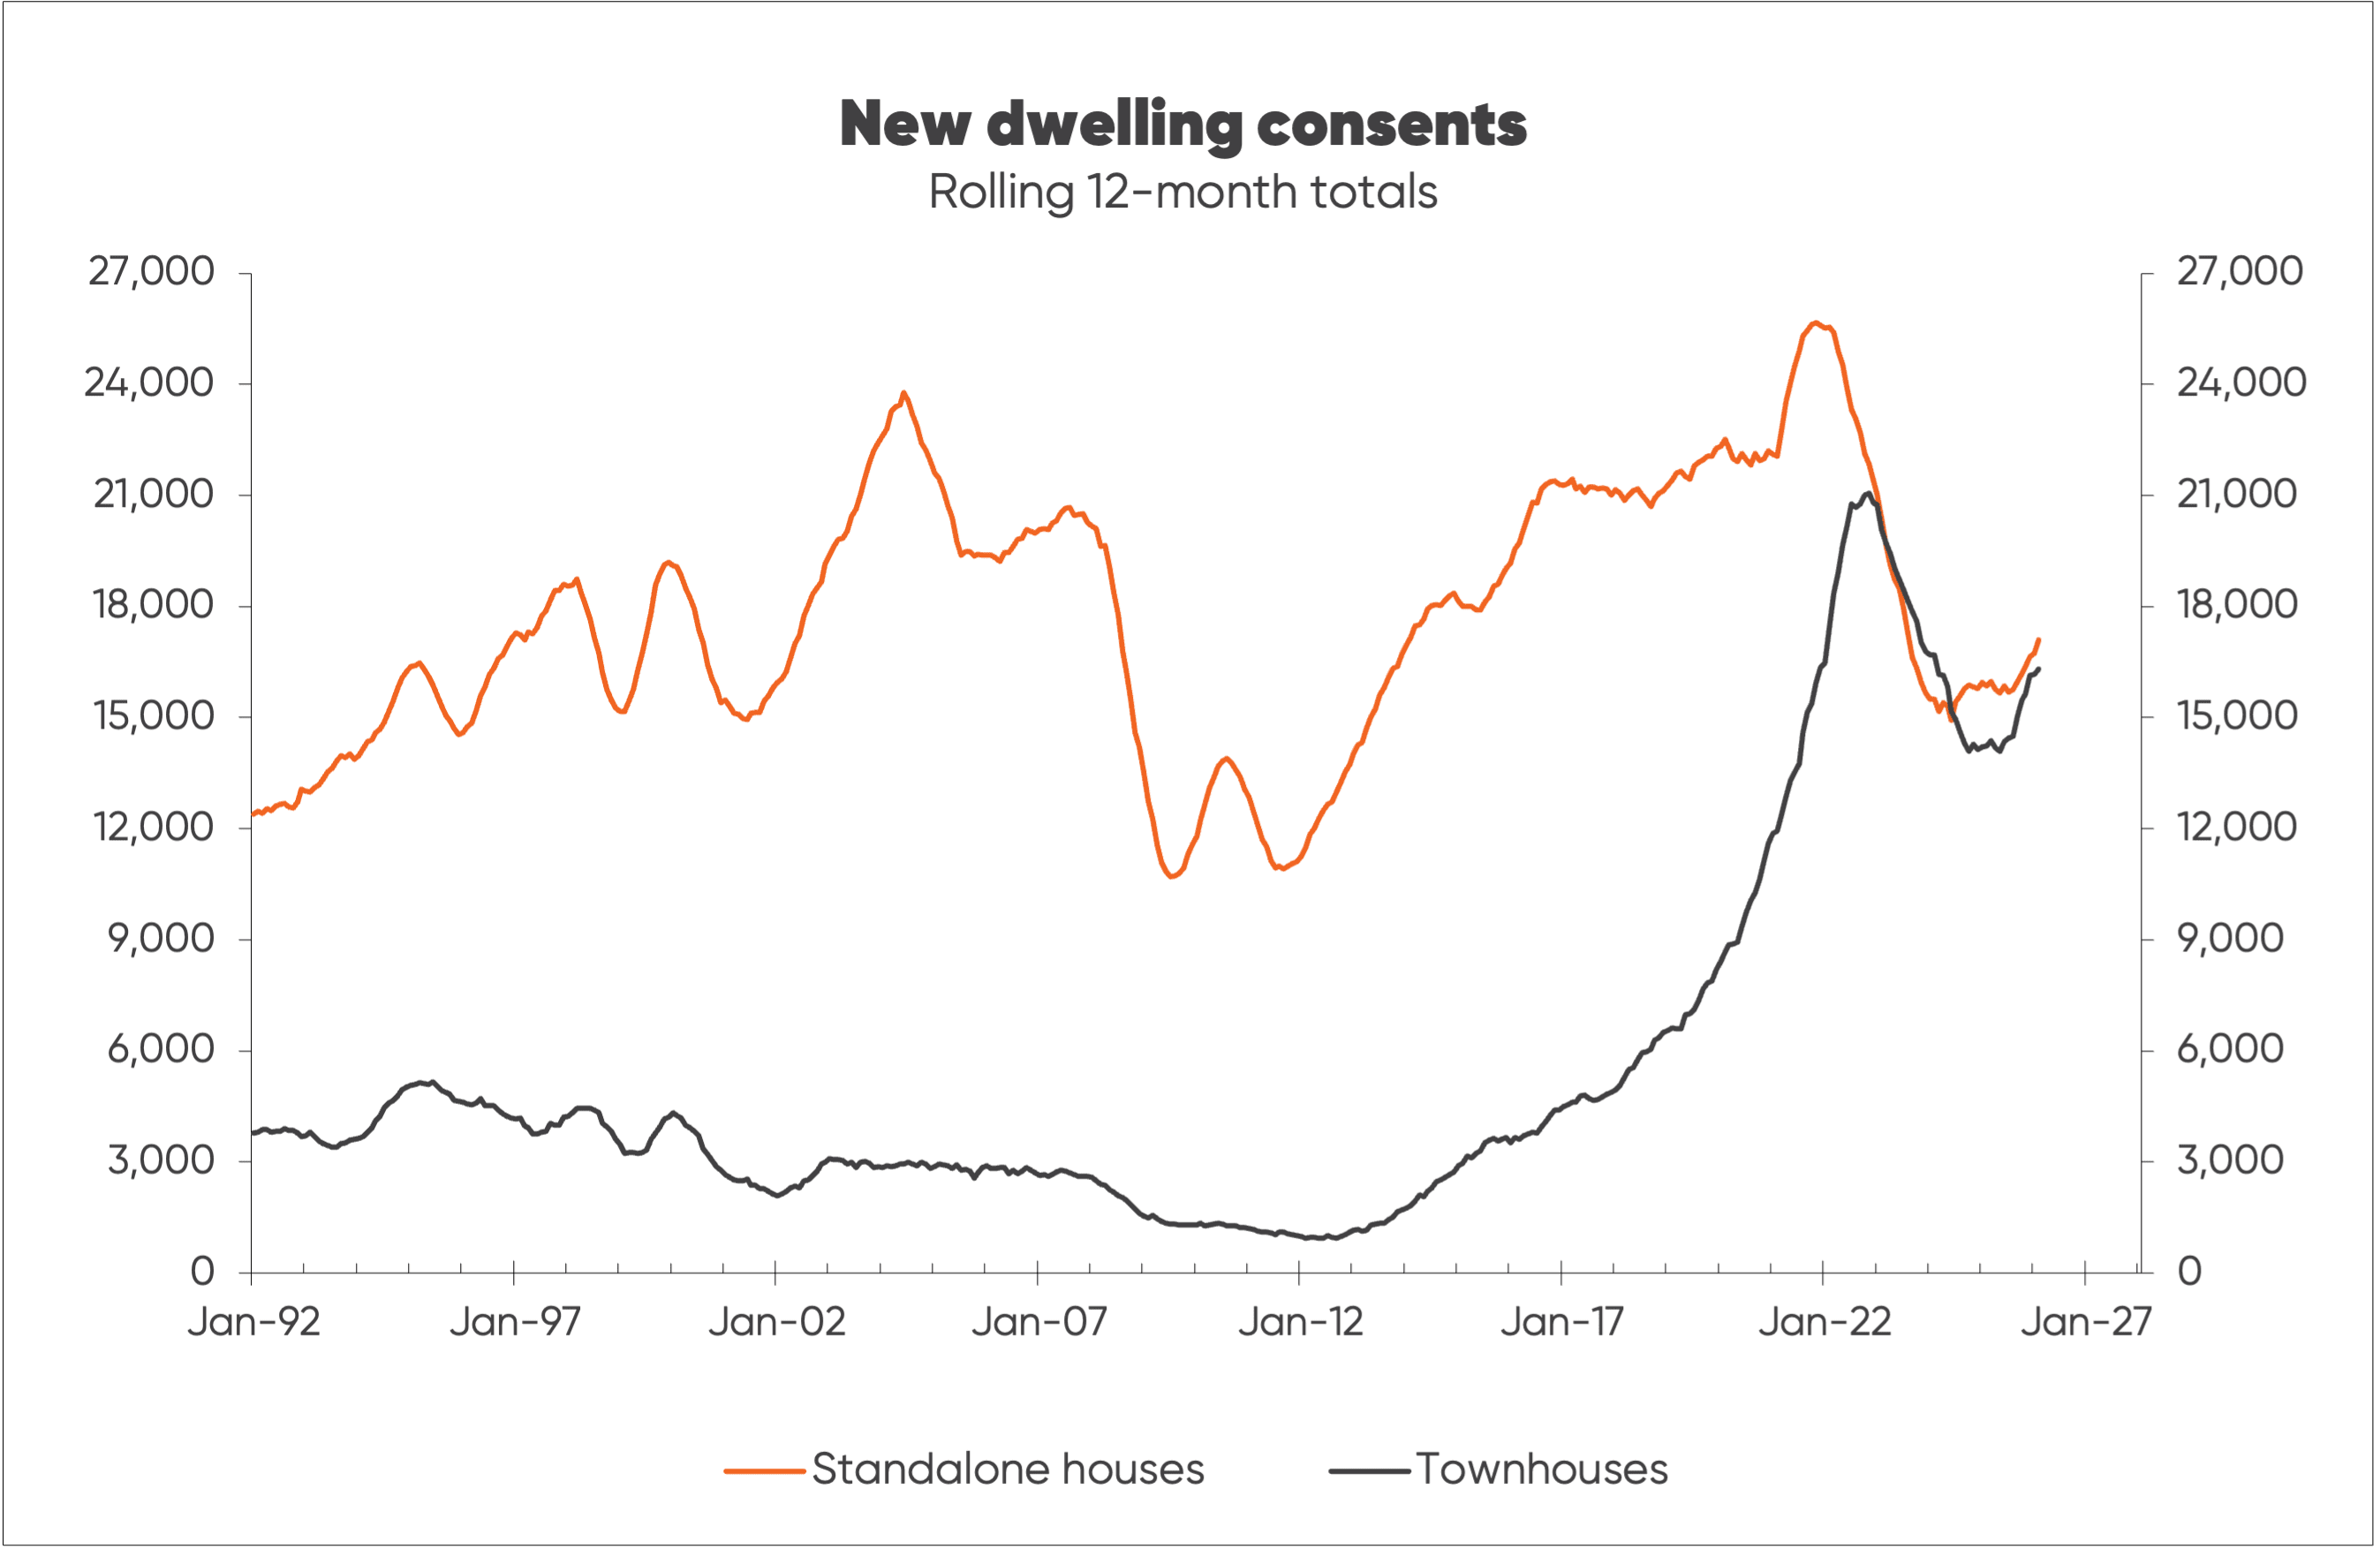
New townhouses are roughly 30% smaller (on average) than new standalone homes, while the building cost per square metre is similar, meaning townhouses have offered a much more affordable option for people prepared to live in smaller homes.
The mega-boom in townhouse construction has contributed to an above average increase in housing stock, while (more recently) lower population growth has meant below average growth in housing demand.
As a result, despite existing dwelling sales having returned to around average, for-sale listings have stayed elevated in the last couple of years—and house price has inflation remaining pretty flat (near zero).
This is despite REINZ dwelling sales having risen to a level that—in the past—would have justified close to 10% annual upside in house prices as shown in the third chart.
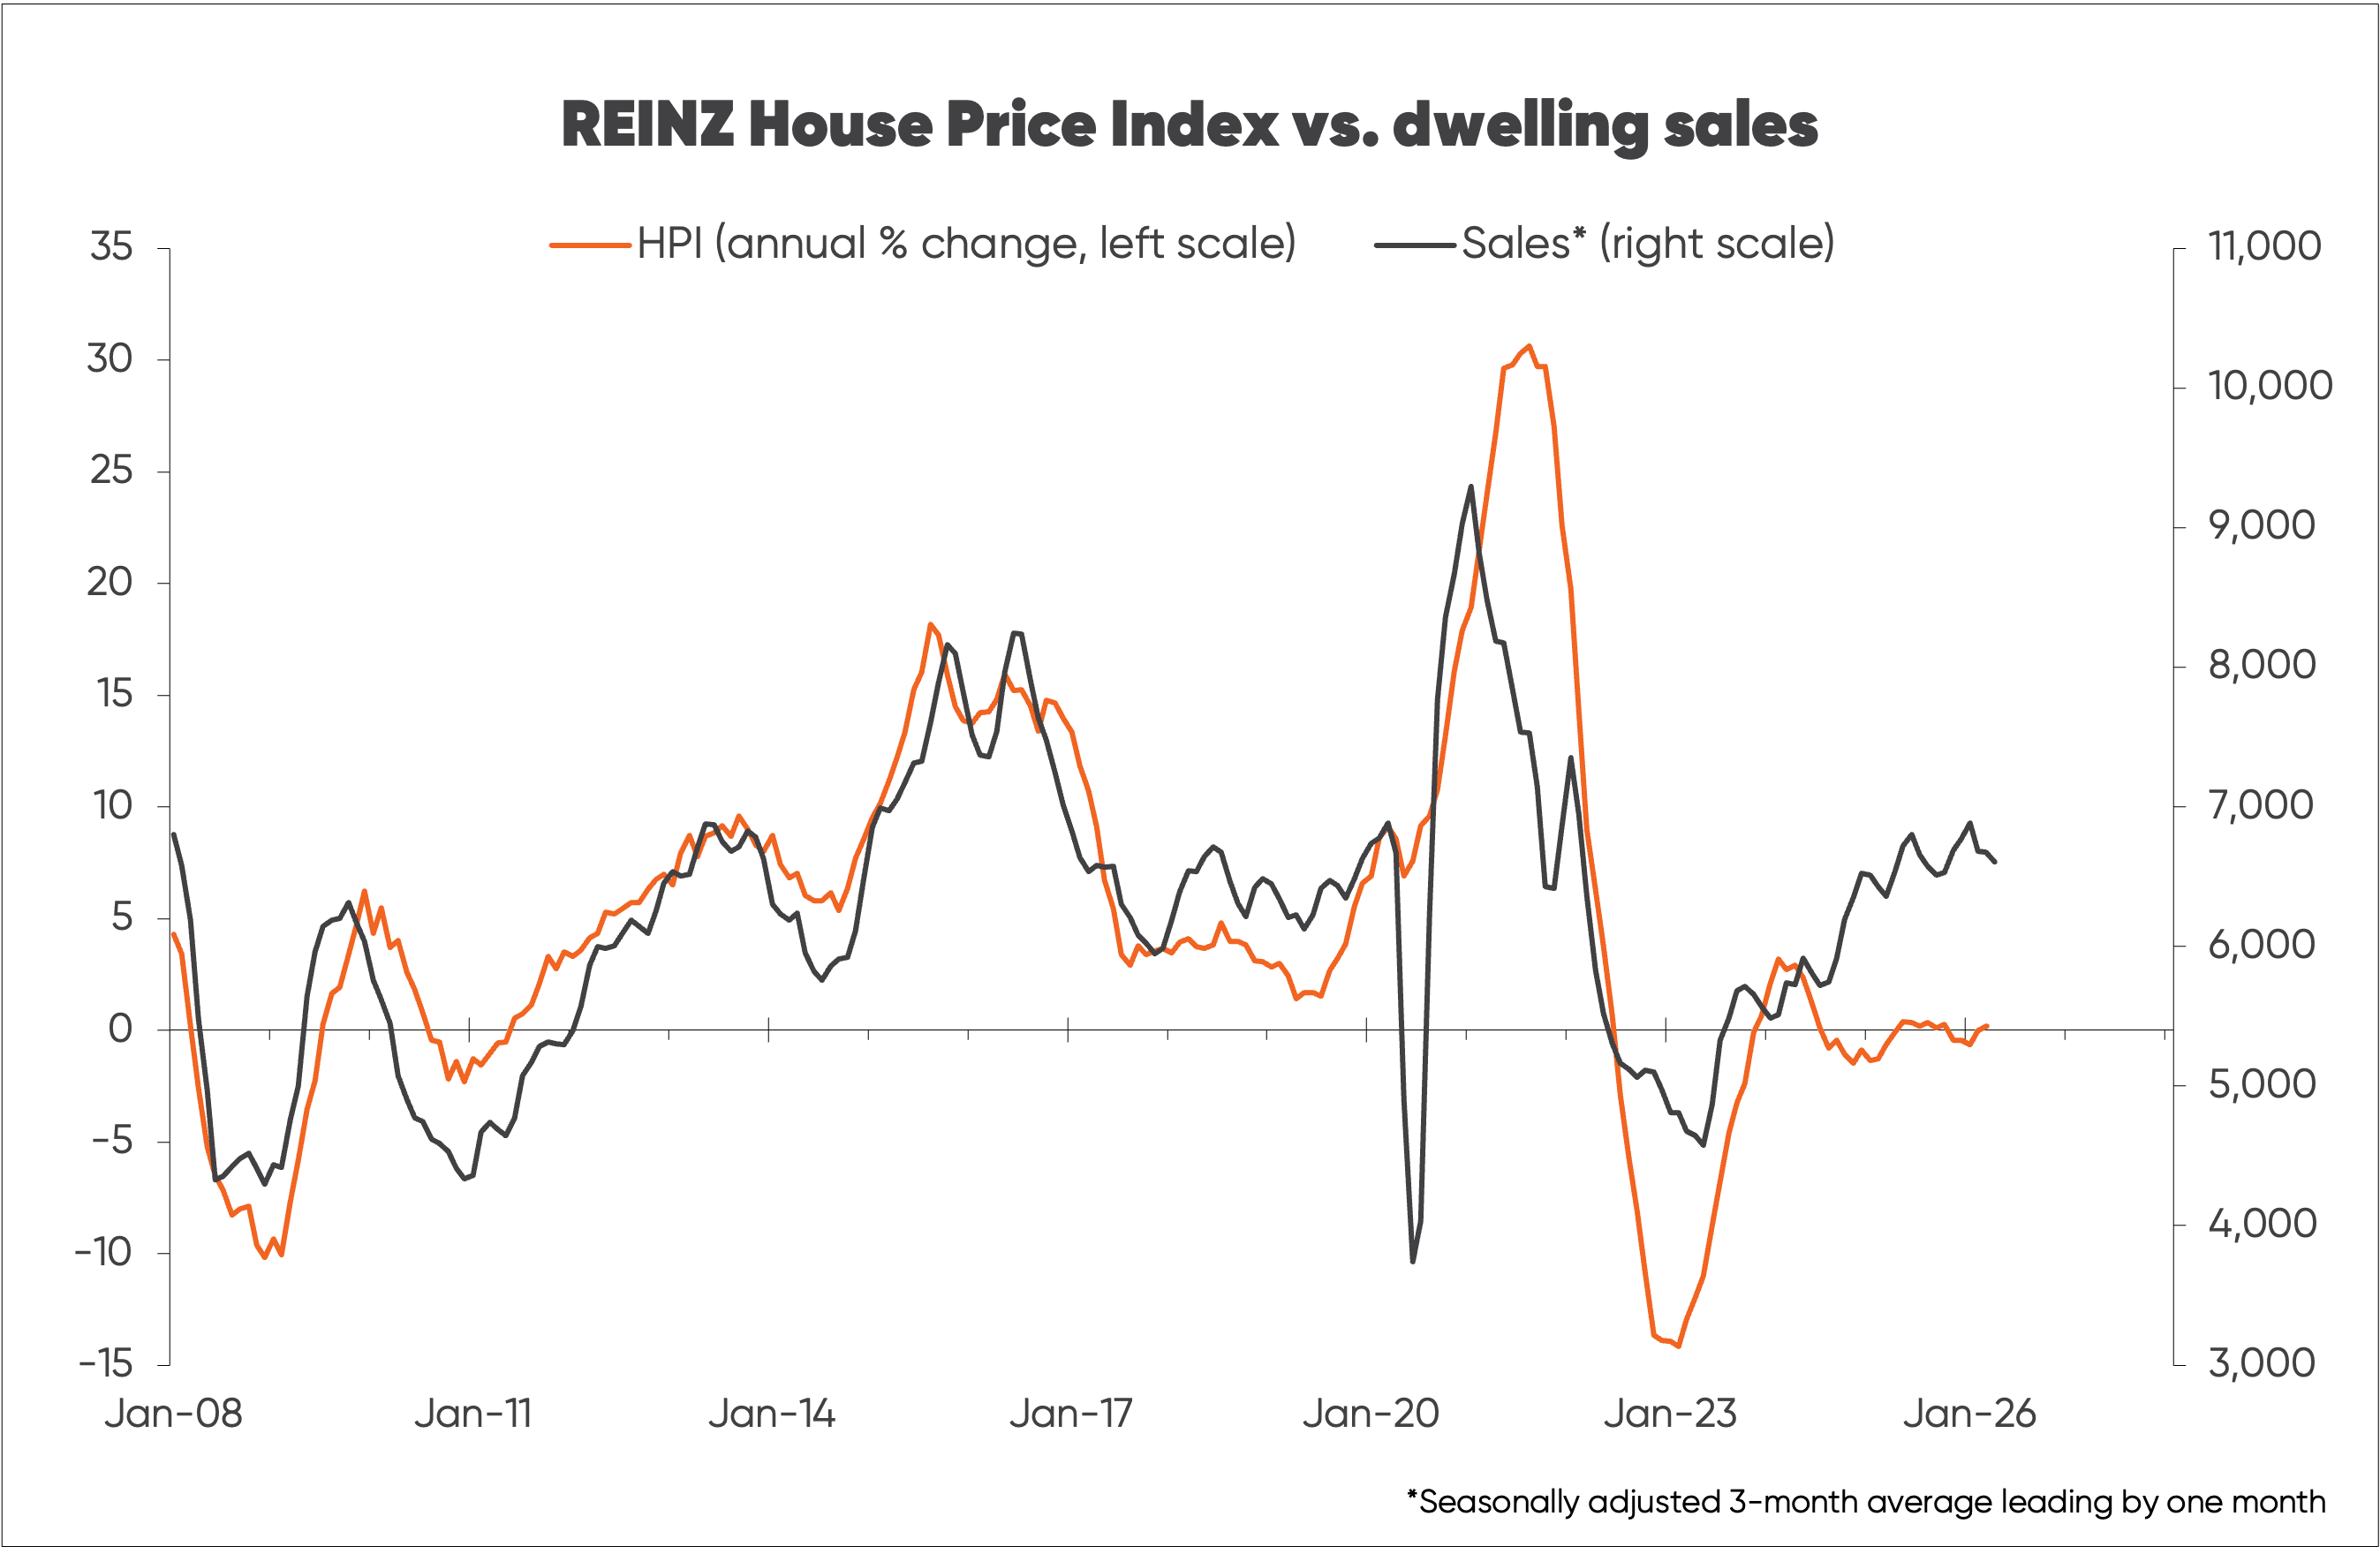
Now, rising interest rates have the potential to drive some downside in REINZ sales numbers, and possibly further downside in existing house prices.
By contrast, there are signs building costs are starting to increase—to a small extent driven by rising new dwelling consents, but more as a result of the US-Israel war on Iran boosting oil prices, and the flow-on effect to building costs.
If building costs rise it will make existing housing look more affordable by comparison and this should in time filter to some upside in existing house prices.

About the author: Rodney Dickens, Strategic Risk Analysis - Managing Director
As far as economists are concerned, Rodney’s about as seasoned as they come. Having started out his career at the RBNZ—including a stint on its Monetary Policy Committee—he’s held roles as Head of Research and Chief Economist inside several of New Zealand's big banks and leading financial institutions, and worked for the Bank of England. He launched Strategic Risk Analysis in 2006, regularly reporting on the state of the economy, housing market and interest rates.