

Over the last 35 years, the single biggest driver of GDP growth in New Zealand has been growth in the workforce.
Related to that has been growth in the number of consumers—with consumer spending by far the largest component of GDP, making up 65% of the total in Q2 2025.
An interesting aspect of New Zealand's workforce growth has been the trend of increasing female participation in the labour force.
My back-of-an-envelope calculation shows that a rising female participation rate has added almost 10% to employment since 1990.
However, it seems this source of economic growth has come to an end.
More workers, machinery, infrastructure, and natural resources—aided by innovation and working smarter—are normally described as being at the heart of economic growth.
Between Q1 1990 to Q2 2025, GDP increased 150%, while over the same period there was an 87% increase in employment as shown in the first chart.
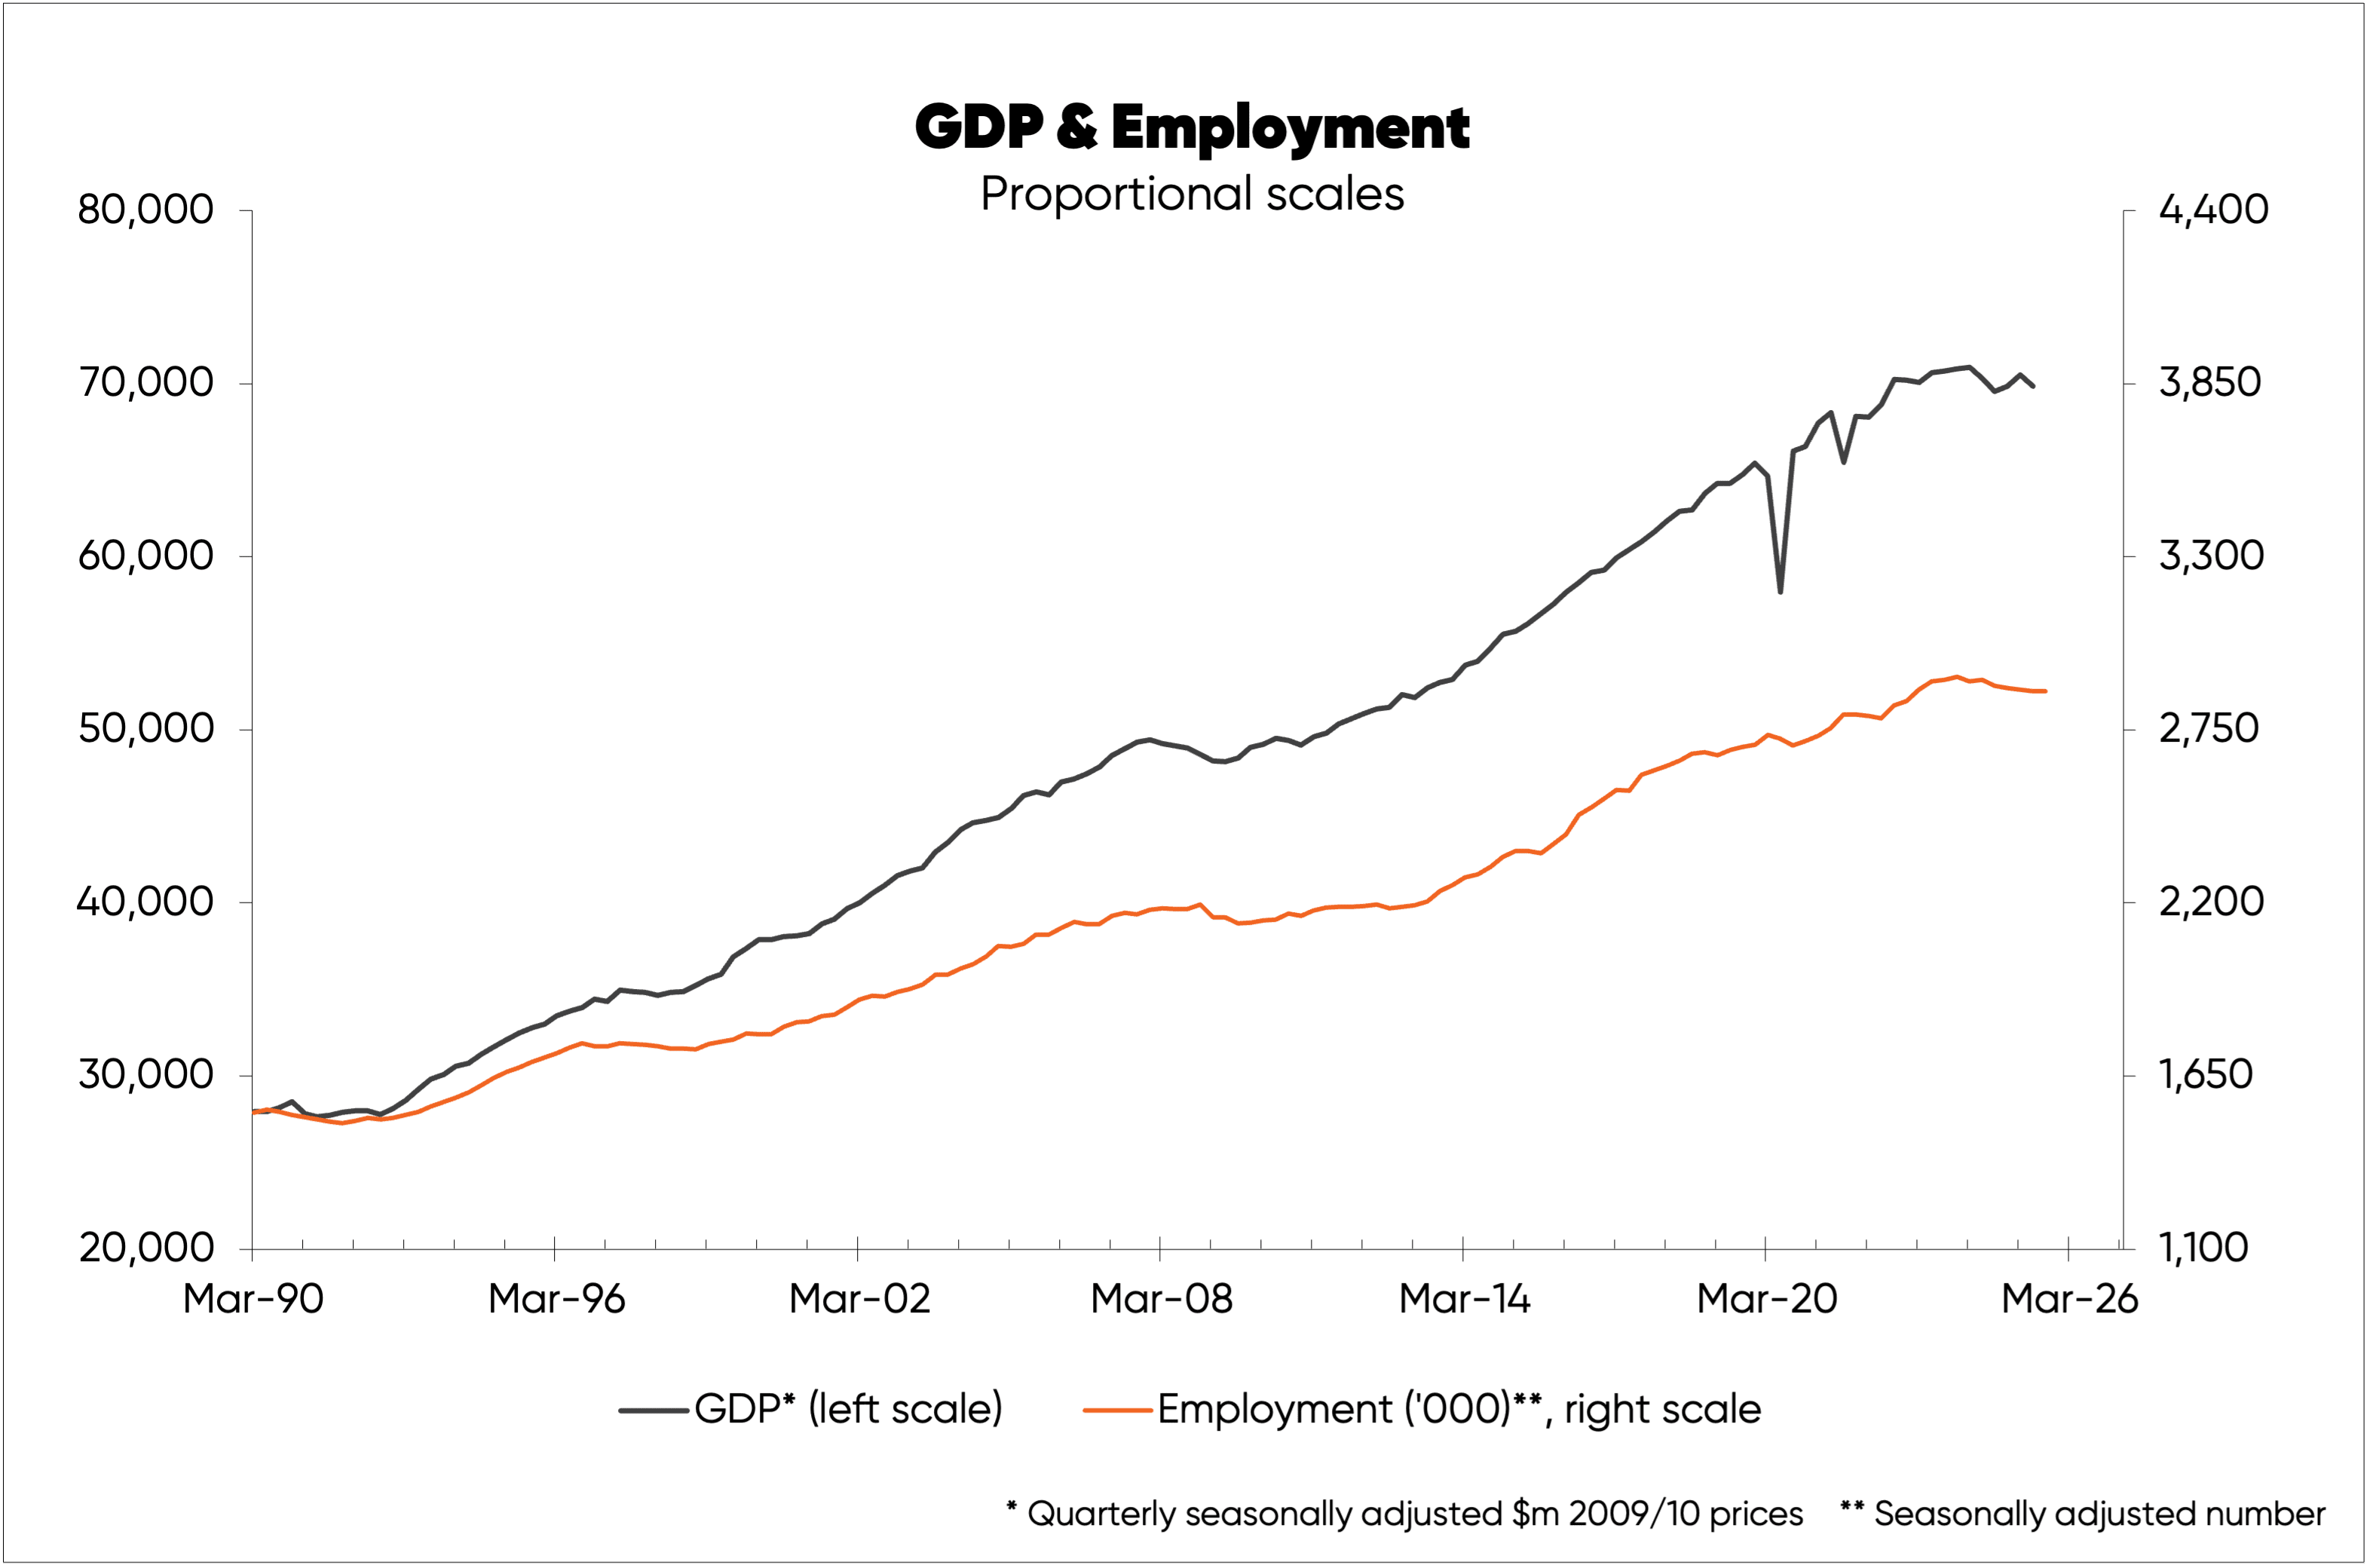
Since 1990, the simple fact of an increase in the number of workers (and consumers) has contributed to over half of New Zealand’s GDP growth.
Adding to this further is the fact that output per worker has risen 33% from Q1 1990 to Q2 2025, as shown in the second chart.
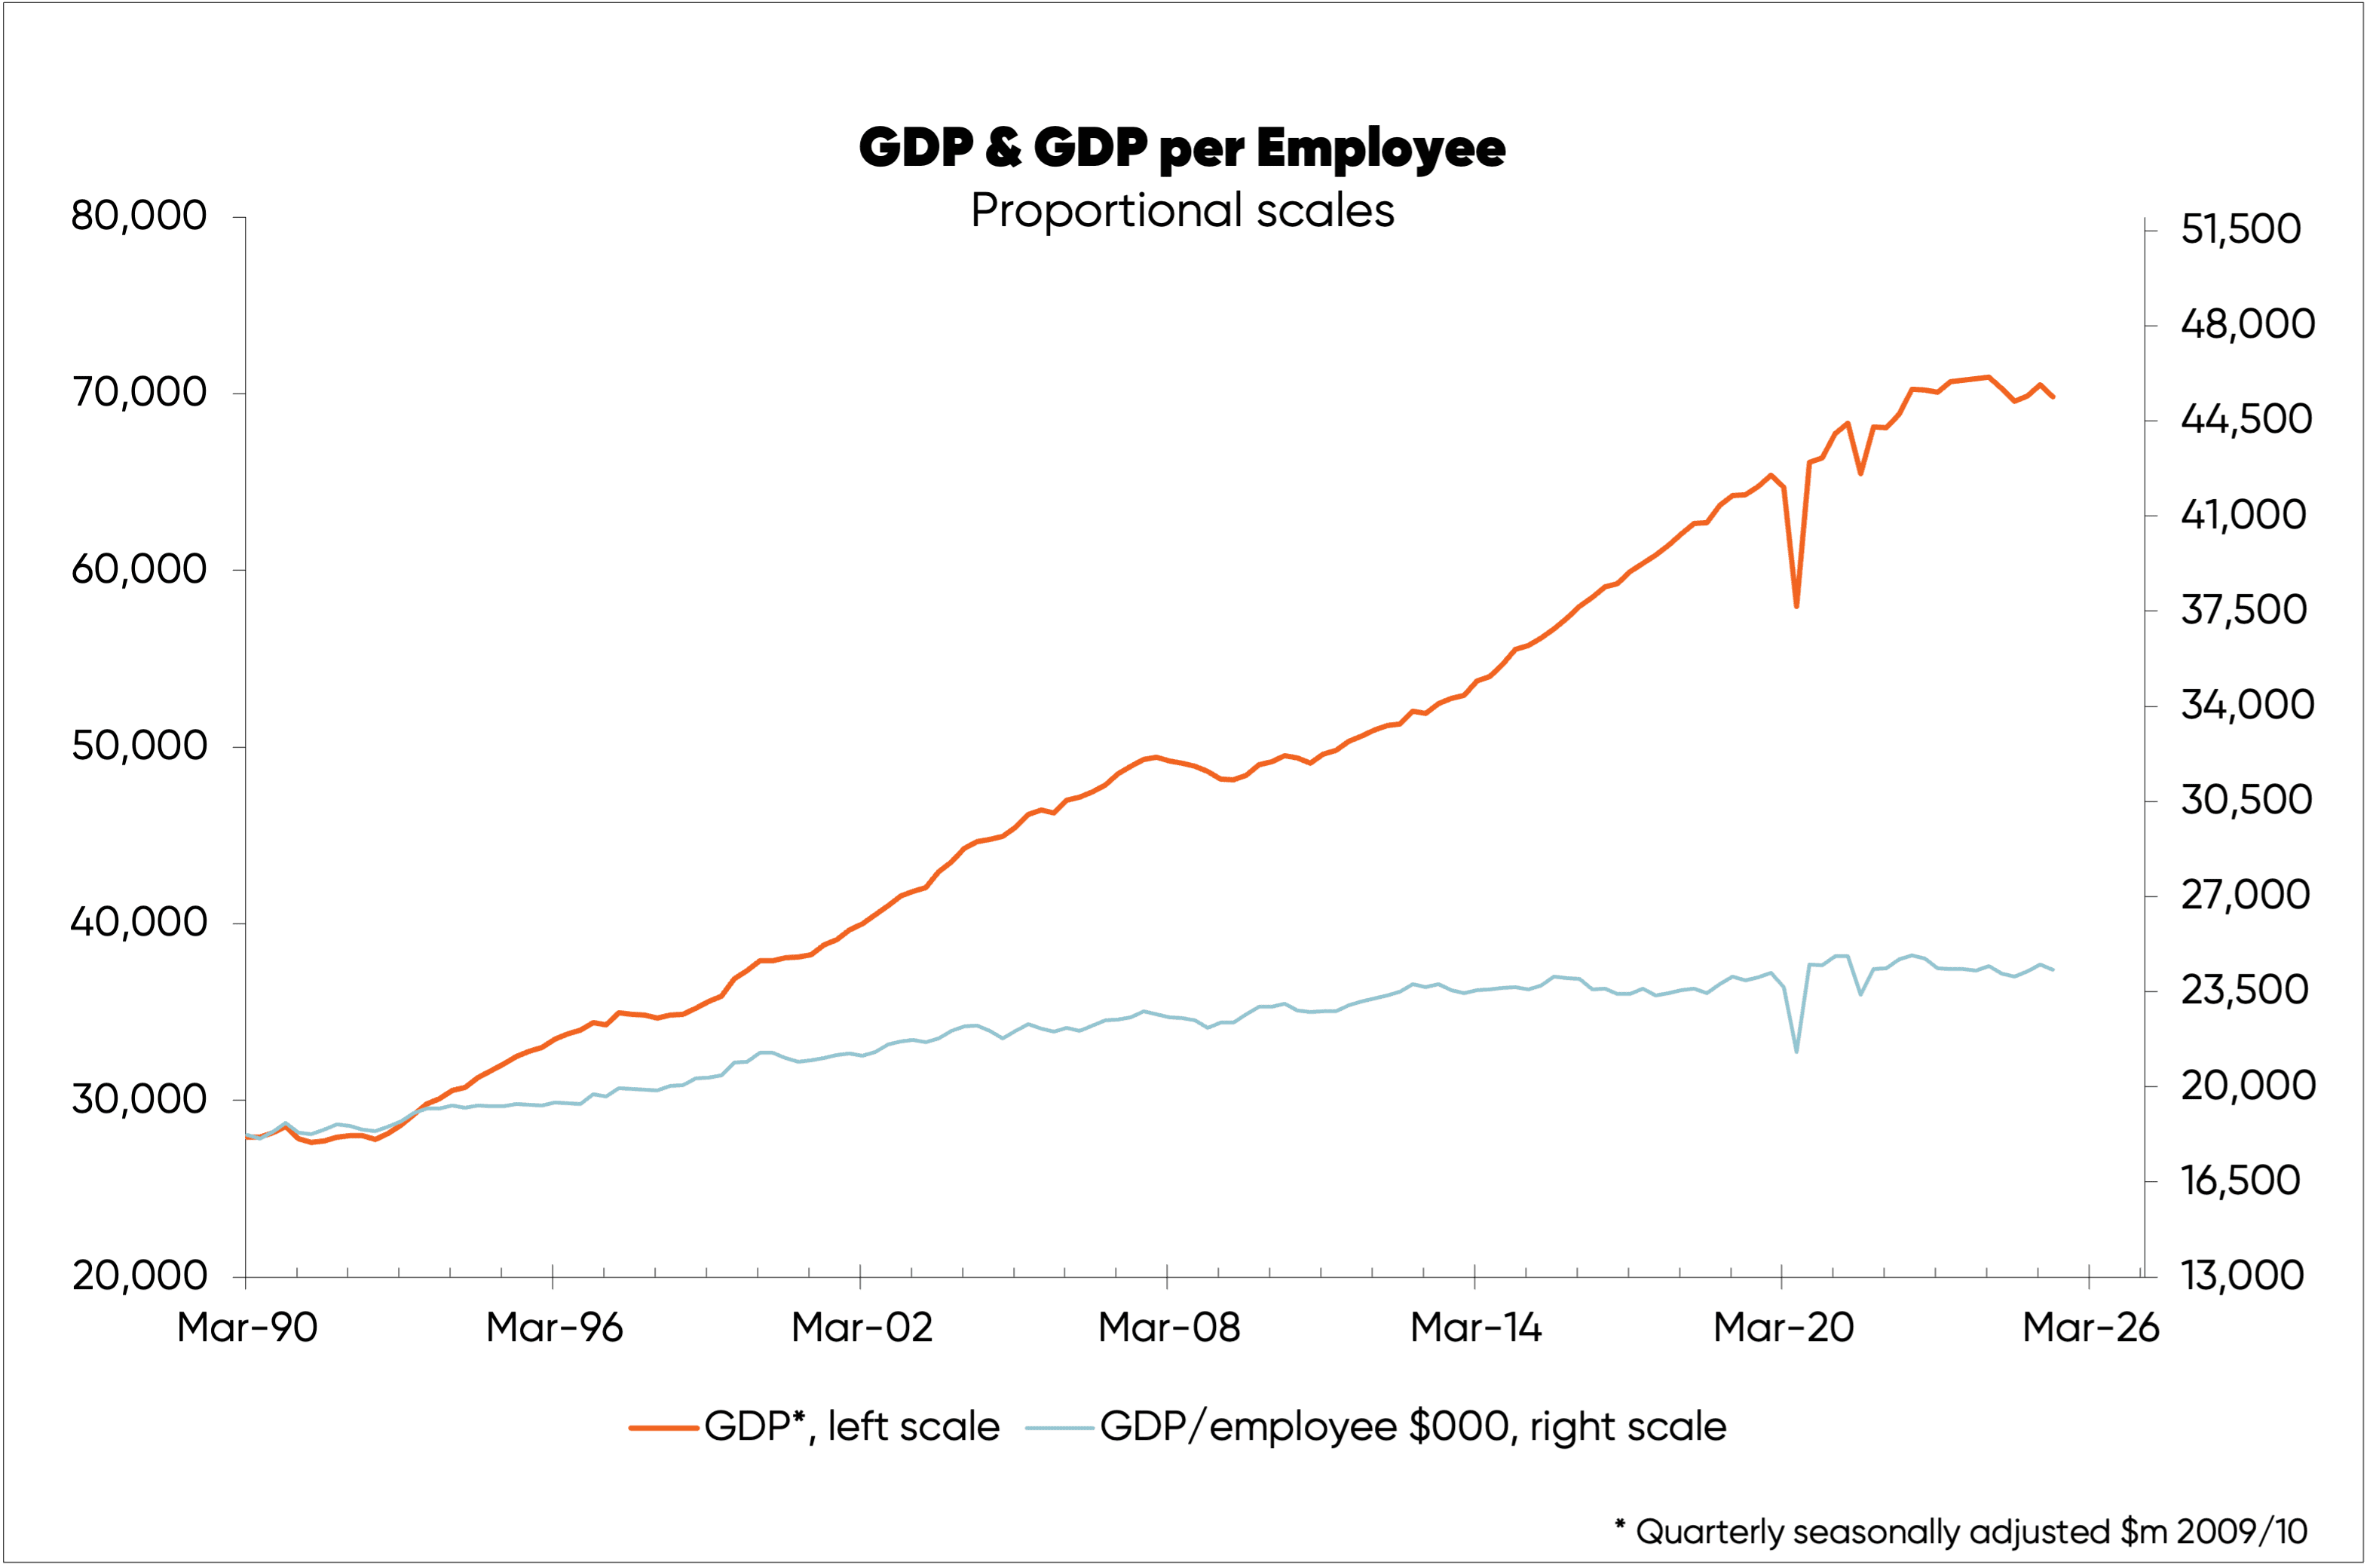
More workers boost GDP; innovation and working smarter boost GDP; while a combination of more workers and those extra workers being more productive also boosts GDP.
It is this third factor which explains why the combined 87% increase in workers and 33% increase in output per worker don’t add up to the 150% increase in GDP.
An interesting part of the increasing number of workers since 1990 has been rising female participation rate in the labour force a.k.a. the percentage of working-age females who are looking to work.
In Q1 1990, 53.5% of New Zealand’s female working-age population sought paid work, but by Q3 2025 the female participation rate in paid work was 66.2%.
Over the same period the male participation rate rose just 0.3% from 74.2% to 74.5% (see the third chart).
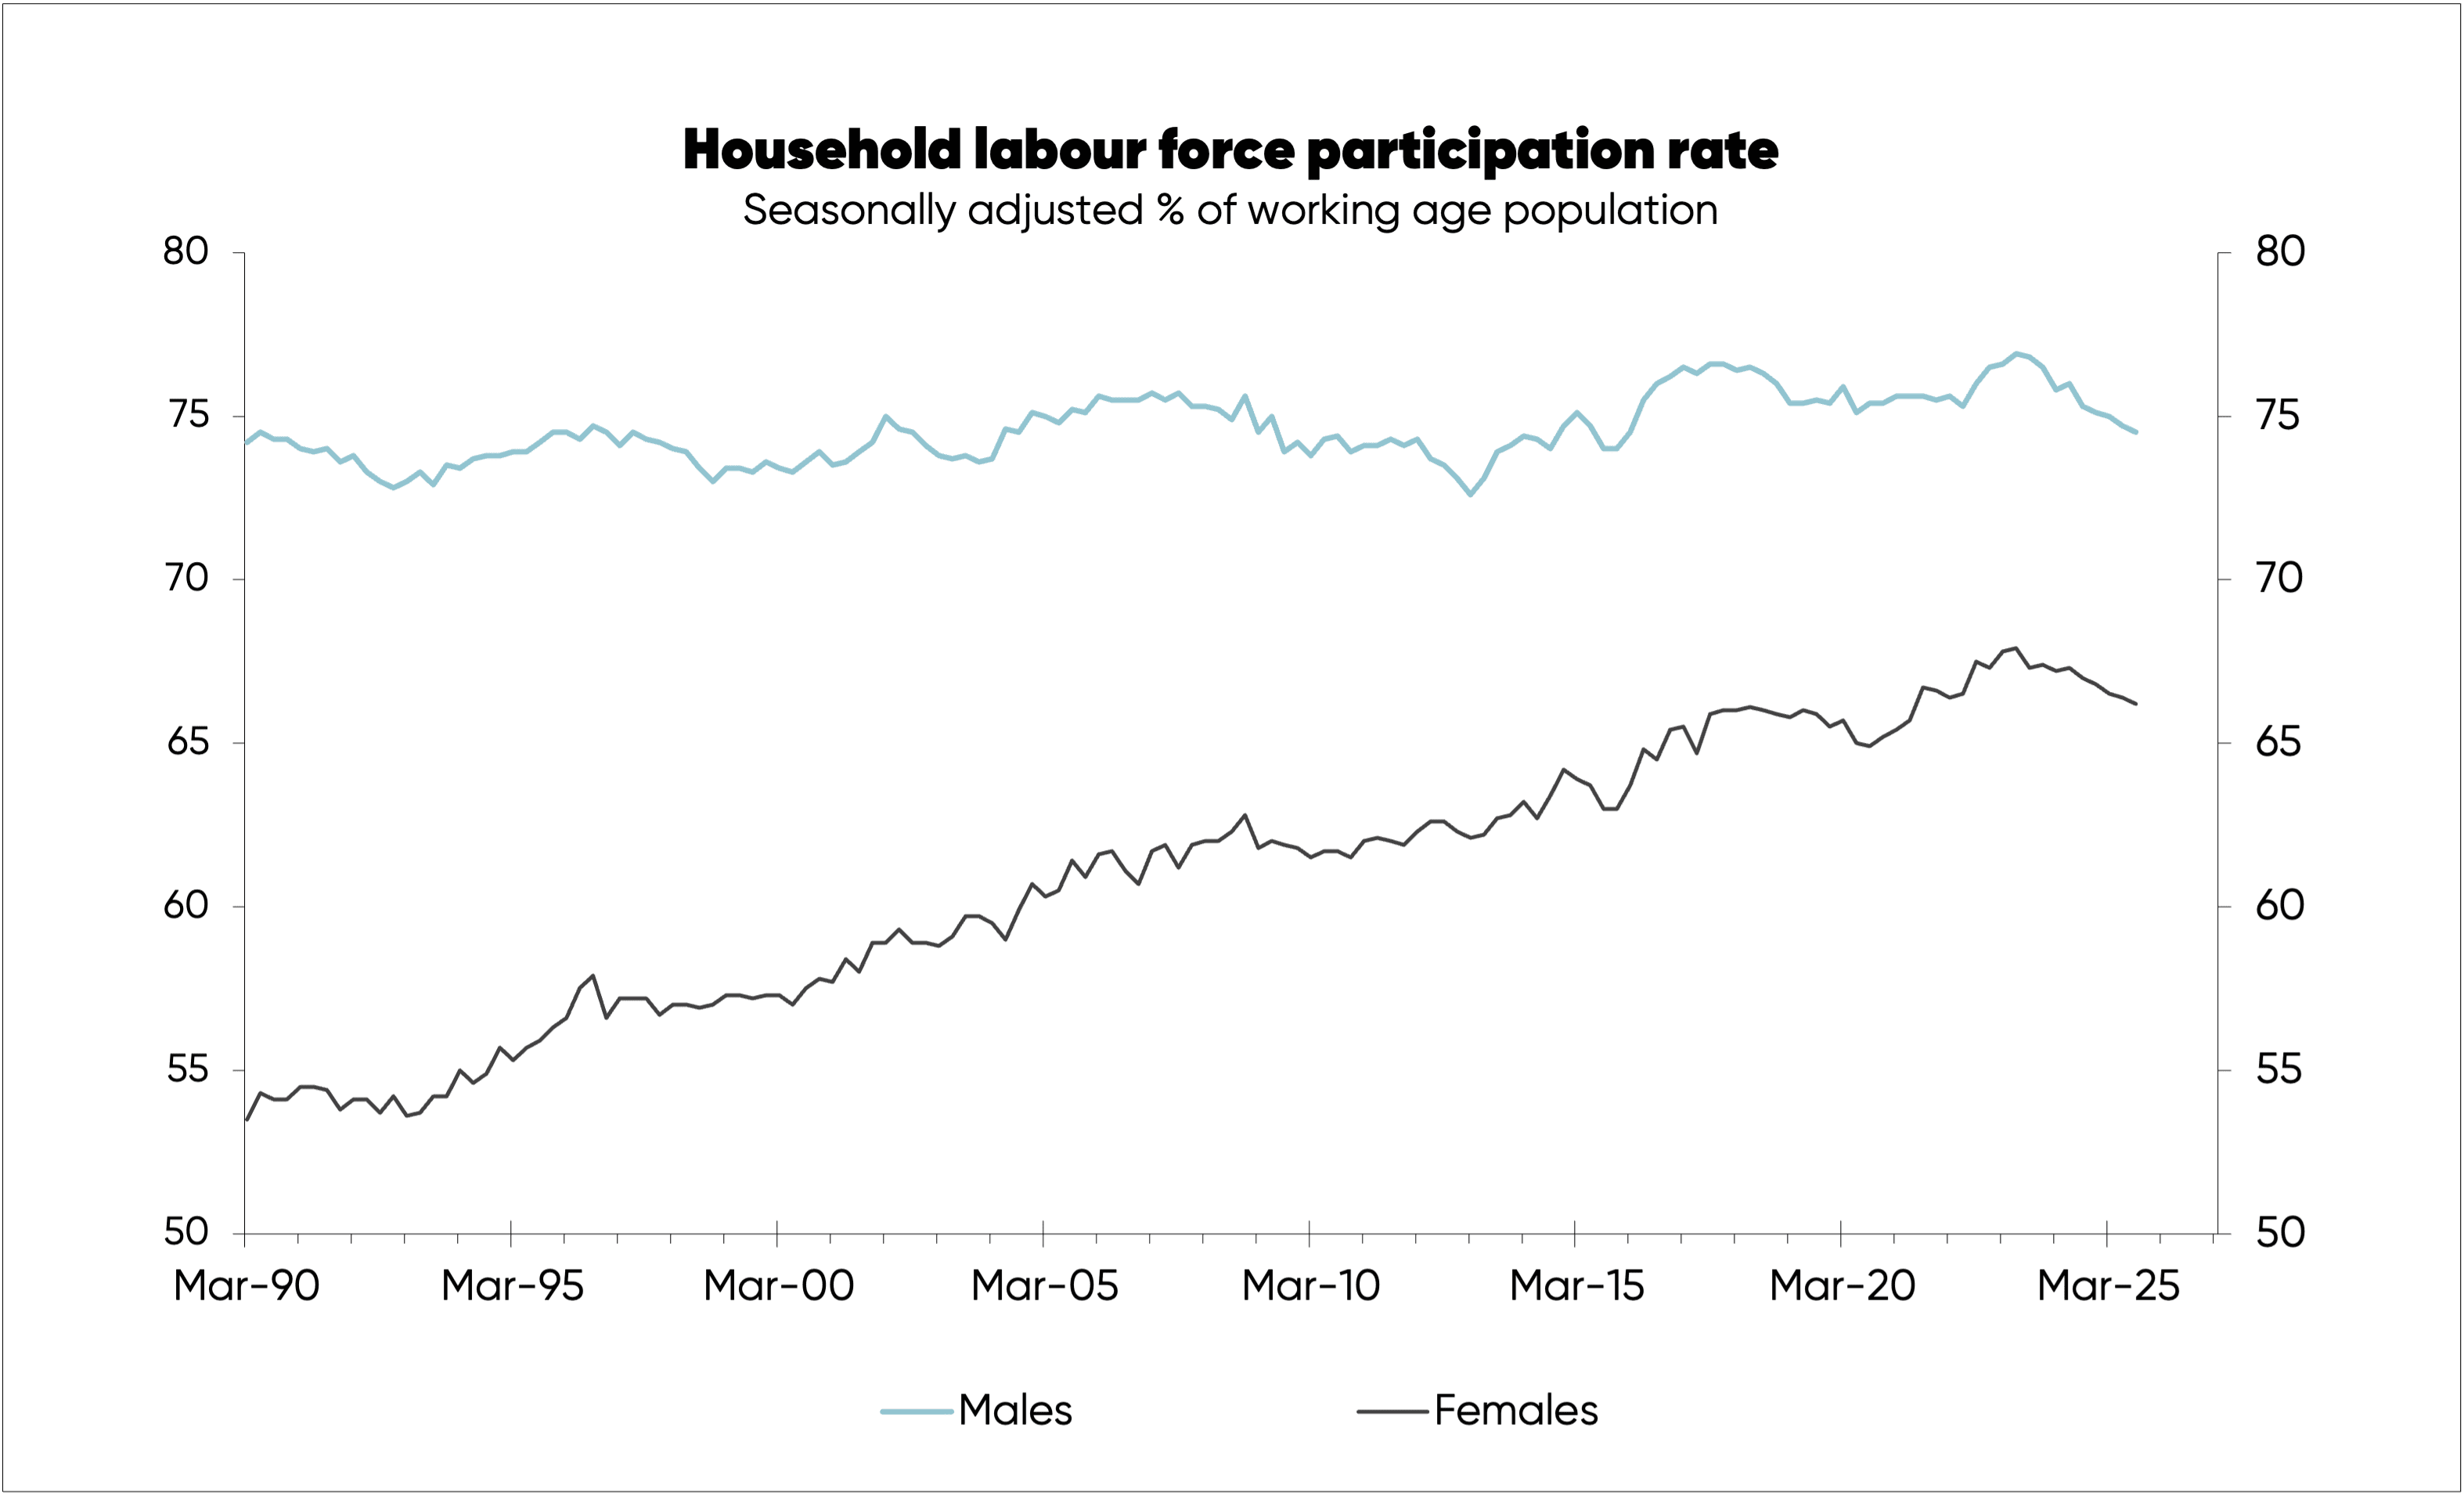
We’ve seen both male and female participation rates fall since early-2023, reflecting the impact of the recession with recessions and periods of low economic growth discouraging some people from looking for work.
As economic growth improves—as it inevitably will now the Reserve Bank is in growth-friendly mode—both participation rates will recover.
If the female participation rate had stayed as it was in 1990 278,000 fewer females in the labour force now—i.e., around 1,169,000 versus the 1,447,000 reported by Statistics NZ for the third quarter of 2025).
Assuming nothing else had changed—a big assumption but necessary to put the rising female participation rate into context—there would be almost 10% fewer people employed now than there are.
Less workers would mean lower GDP and, more importantly, lower average income per person.
Although there are still hints of underlying upside in the female participation rate (third chart) growth in the female percentage of total employment appears to have ended some time ago (fourth chart).
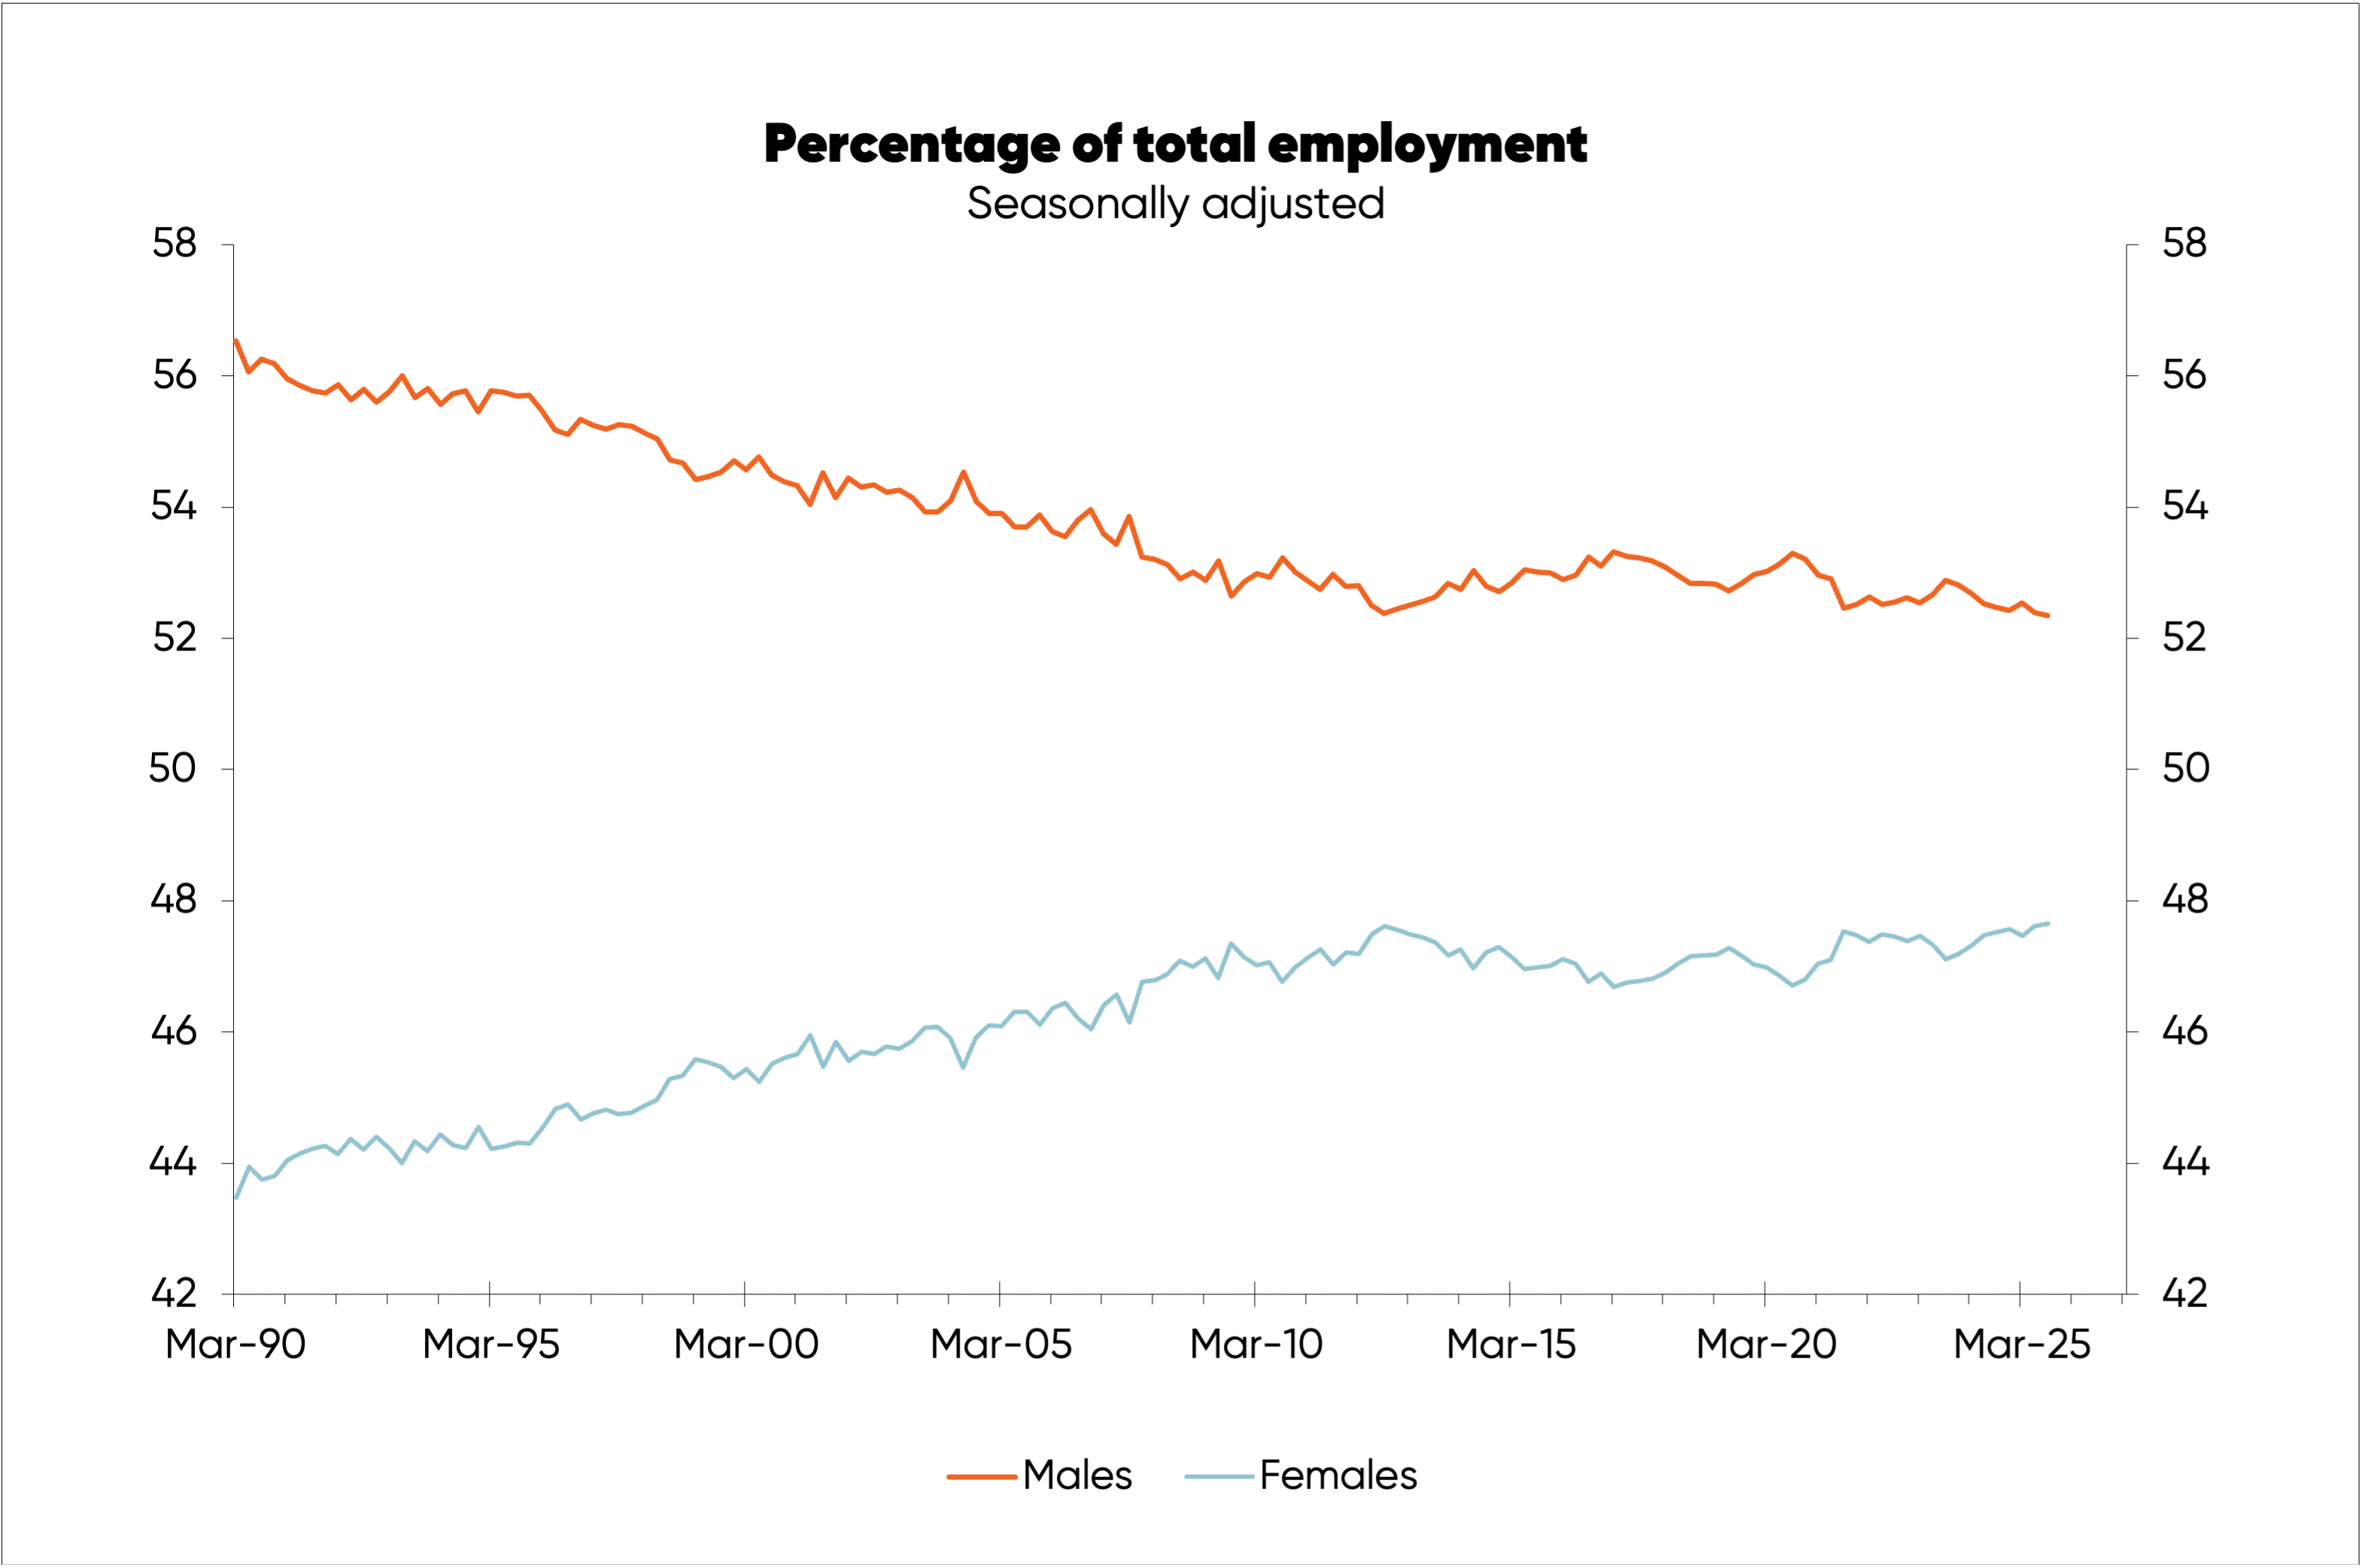
The obvious implication is that a reasonably important factor behind New Zealand’s economic growth—and growth in income per person or per employee—that had largely flown under the radar has probably ended.
By Rodney Dickens, Managing Director, Strategic Risk Analysis Ltd www.sra.co.nz.