- Get started on your mortgage
- Buying your first home, next home, investing in property or just keen to review your mortgage?
- Apply online
- Put your savings to work
- Earn better returns and access your money with no penalties.
- Start investing now
Rodney's Ravings: RBNZ doesn't need new labour market indicators, it needs better judgement


Guest post by Rodney Dickens
In a nutshell:
- The Reserve Bank (RBNZ) has released a research paper highlighting the four key labour market indicators it believes provide the best gauge of inflationary pressures in New Zealand.
- This sounds great, in theory, but the massive mistakes the RBNZ has made in recent years are not because it wasn’t focusing on the right indicators. It was because of its shocking judgement and interpretation of what even basic labour market indicators are saying.
- The research paper is a case of the RBNZ being busy counting the trees when the forest is on fire.
- In my opinion, the RBNZ will make major mistakes no matter which indicators it watches – and knowing this will help Kiwi make money from the RBNZ’s mistakes.

Identifying the labour market indicators to monitor is a good idea, but it isn’t what’s needed to stop the RBNZ making bad OCR decisions
Recently, the Reserve Bank of New Zealand (RBNZ) released a research paper highlighting the four key labour market indicators it believes provide the best gauge of inflationary pressures in New Zealand.
Those four indicators, including a couple of newly identified ones, are:
- the job transition rate
- the Quarterly Survey of Business Opinion (QSBO) series for labour as a limiting factor
- the vacancy-unemployment ratio
- and the unemployment rate
In the paper, the RBNZ also favours “retaining the full set of existing indicators for understanding the broad context of the labour market” (it monitors 44 separate indicators on an ongoing basis), and “using a new visualisation method to understand the broader context of the labour market”.
Unfortunately, focusing on these indicators won’t stop the RBNZ making big mistakes because the problem isn’t the indicators it monitors, it is how it interprets and makes predictions using them.
Instead of the proposed focus on four key labour market indicators (out of those 44), all the RBNZ really needs is three key indicators and good judgement
Those key indicators are the unemployment rate, labour cost inflation, and core domestic inflation.
Having worked at the RBNZ I’ve seen the problem first hand: sifting through lots of data only to come to the wrong conclusion.
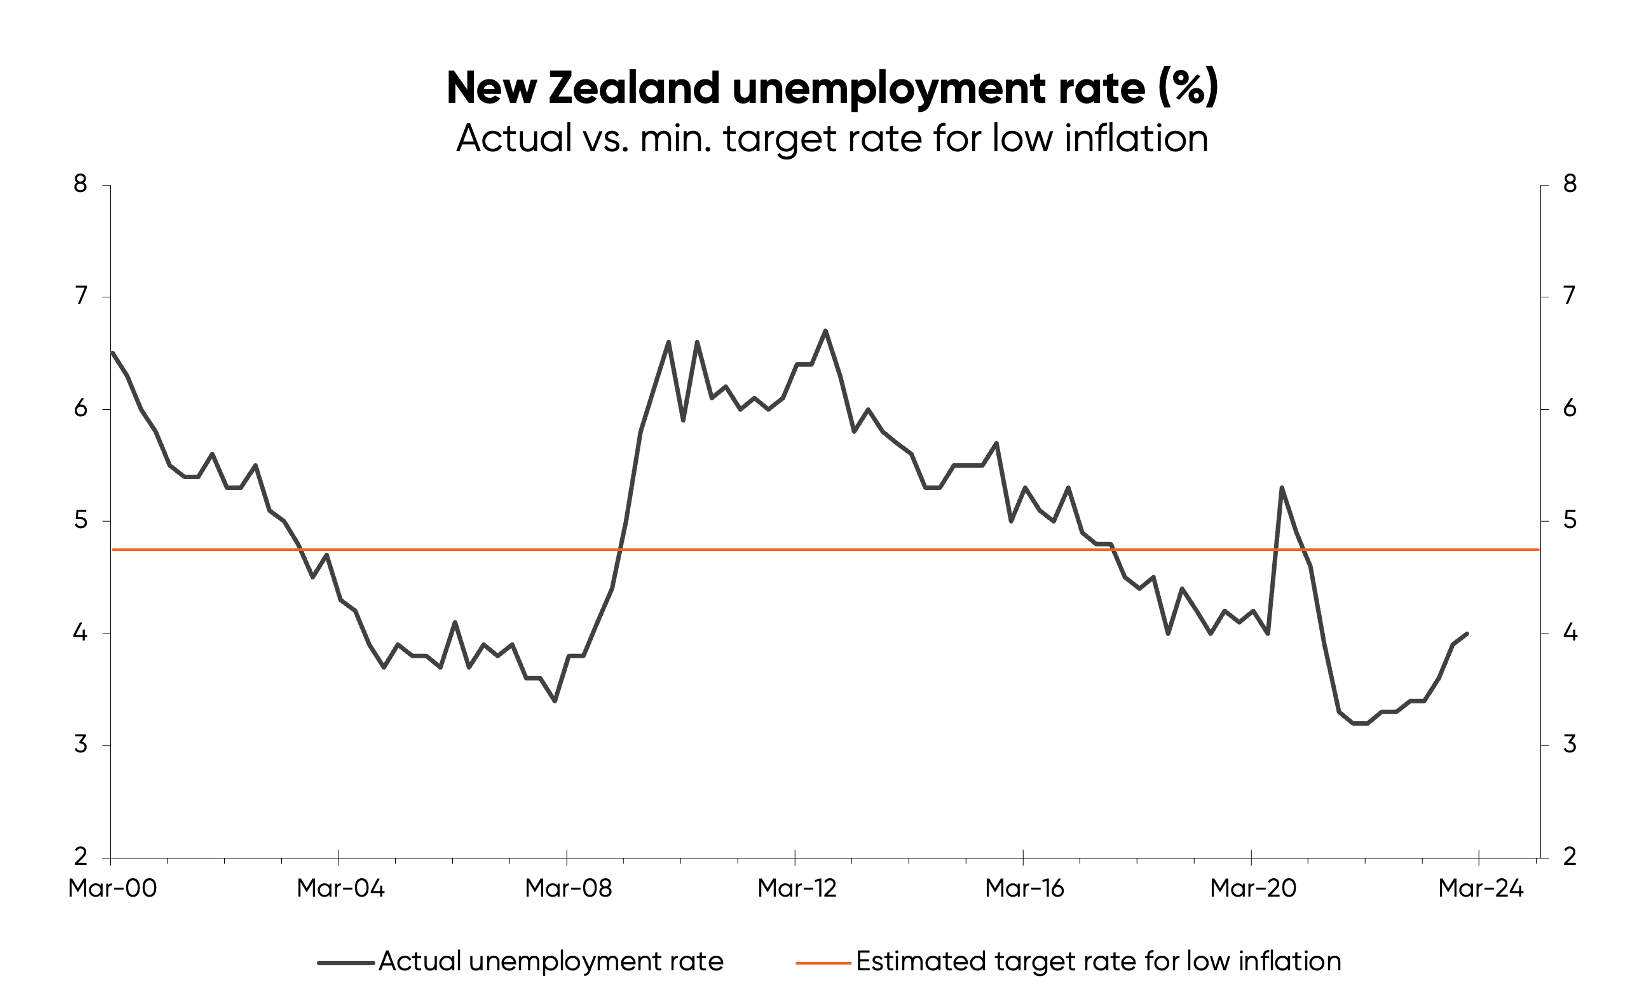
The RBNZ only needed to look at the unemployment rate to know it had fuelled an inflation problem in 2018. Then, in response to Covid, it drove the unemployment rate well below the minimum sustainable level that I estimate to be consistent with its inflation target (shown in the chart below).
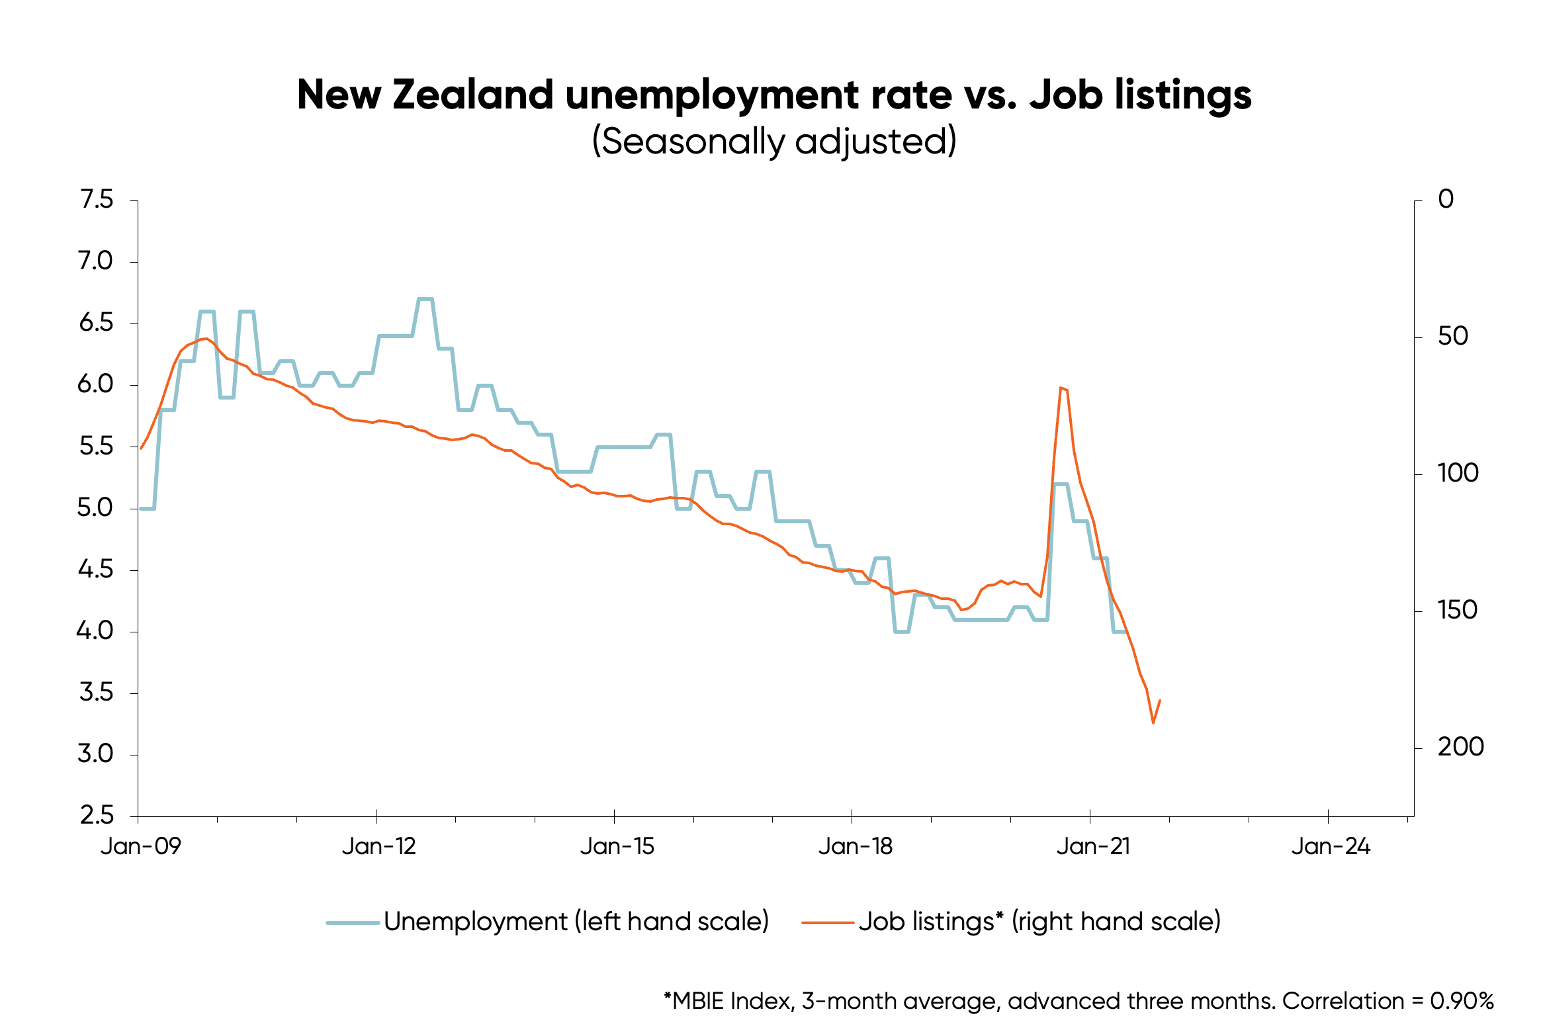
It then waited until after the unemployment rate had fallen to 4% in Q2 2021 before starting to hike the OCR in October of that year. Before the first hike, job ads indicated the unemployment rate would fall significantly further. Again, this is shown in the graph below – the best fit for the data is with job numbers advanced or leading by three months, using the data as it was before the RBNZ delivered its first hike in October 2021.
In other words, the RBNZ let the labour market get much too tight before starting to do anything about it.
And – surprise, surprise – the fall in the unemployment rate, to levels well below the minimum rate the RBNZ should have targeted, was followed 12 months later by the highest level of labour cost inflation New Zealand had seen 30 years – shown below.
![]()
And in line with that, we also saw the highest level of core domestic CPI inflation, based on the RBNZ’s own measure, in 30 years (second chart below).
![]()
I used to visit my ex-colleagues at the RBNZ at times when they were clearly out of touch with the state of the labour market, but gave up because they could not see the wood for the trees. They used to tell me why this time would be different.
Now, new staff are refining the list of indicators to monitor but that is just as much a waste of time because the problem is poor interpretation of the most basic of the labour market indicators, like the unemployment rate and its own leading indicators.
Add to this the RBNZ’s poor forecasting. For example, after the unemployment rate started the plunge deep into inflationary territory in 2021 the RBNZ predicted a limited fall (shown in the chart below).
![]()
Then, just before the adjusted measure of labour cost inflation was about to spike the RBNZ predicted little upside. The chart below uses productivity adjusted labour cost inflation that the RBNZ forecasts versus the unadjusted measure I prefer to focus on.
![]()
The goal here is to persuade you the RBNZ will continue to make major mistakes no matter what list of indicators it watches. Knowing this will help you make money from the RBNZ’s regular mistakes.
By Rodney Dickens, Managing Director, Strategic Risk Analysis Ltd www.sra.co.nz.
Enjoying our blog? Get the latest sent straight to your inbox
Receive updates on the housing market, interest rates and the economy. No spam, we promise.
The opinions expressed in this article should not be taken as financial advice, or a recommendation of any financial product. Squirrel shall not be liable or responsible for any information, omissions, or errors present. Any commentary provided are the personal views of the author and are not necessarily representative of the views and opinions of Squirrel. We recommend seeking professional investment and/or mortgage advice before taking any action.
To view our disclosure statements and other legal information, please visit our Legal Agreements page here.
